
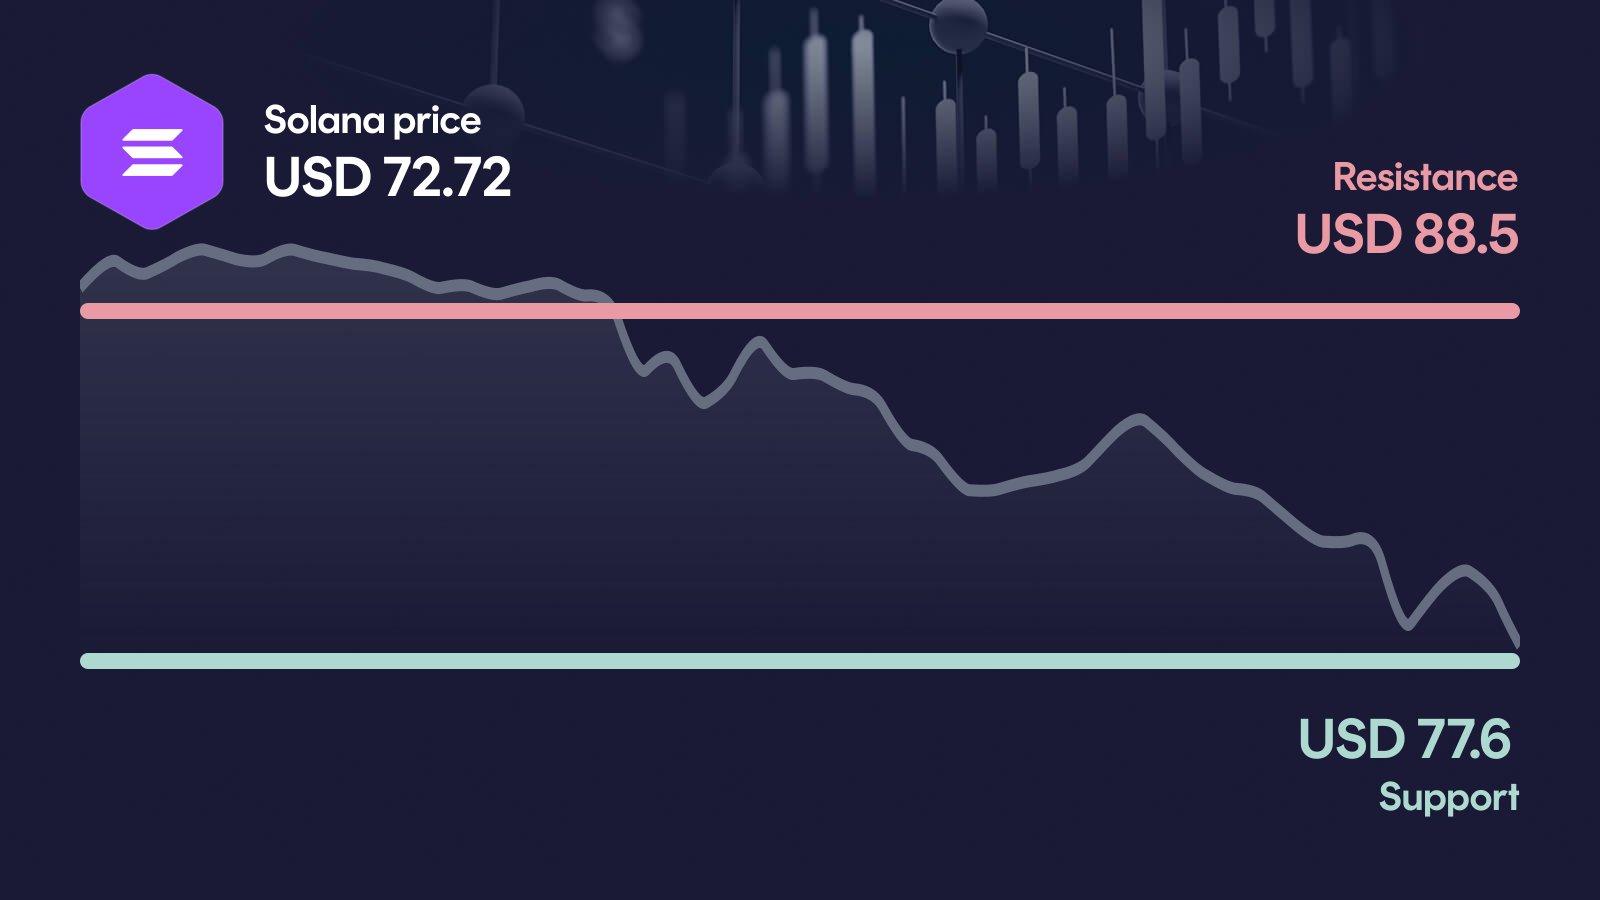
Solana is under heavy pressure: SOL has lost more than 9% in 24 hours and is trading at $72.72, below the primary support at $77.60. The RSI has crashed to 23, deep in oversold territory, while MACD remains clearly bearish. The question now is whether buyers step in near $73.70 or whether the next leg down opens the door to further losses.
Key takeaways in a nutshell
Sharp daily drop: SOL trades at $72.72 after a 9% decline in 24 hours and is down more than 18% on the week.
Trend clearly broken: The price sits 30.7% below the 50-day average ($105) and 18.2% below the 200-day average ($88.90).
Support already lost: The primary support at $77.60 has given way; the next relevant zone sits at $73.70.
RSI deeply oversold: At a value of 23, the RSI signals an extremely stretched move, but not automatically a reversal.
AI model sees room: For year-end 2026, the AI forecast model projects a range between $90.02 and $121.51.
What happened to the Solana price?
Solana has slid to $72.72, losing more than 9% in a single day and over 18% on the week. With that move, SOL has not only broken below the primary support at $77.60, it has also pushed below the recent weekly low of $77.20. The 30-day performance now stands at roughly minus 31%, underlining how quickly the picture has deteriorated.
The striking detail is the volume: at $3.57 billion over 24 hours, trading activity is about 37% above the 30-day average. That is not a quiet drift lower, but a move driven by conviction on the sell side.
Key price levels for Solana
On the upside, the first serious hurdle sits at $88.50; only a reclaim of this zone would meaningfully ease the bearish pressure and bring the 200-day average back into play. The nearest support is now $73.70, a level that matters because the previous floor at $77.60 has already given way. If that zone also breaks, the next orientation on the downside opens up toward $80.50 as former support turned reference, with little technical cushion below current prices.
Solana indicators: RSI, MACD and volume
The three indicators currently paint a consistent picture, and it is not a friendly one. The RSI has collapsed to 23, deep in oversold territory, which signals an extremely stretched move but not automatically a reversal. The MACD stands at -5.78 with a clearly bearish signal, and the histogram shows no sign of turning higher. Volume at 37% above the 30-day average confirms that sellers are in control of this move rather than it being a thin-liquidity flush. Taken together, the indicators describe a market in strong downtrend, where any bounce would first need to be confirmed before it can be trusted.
Relative Strength Index
MACD
AI forecast for Solana
Looking toward year-end 2026, our AI forecast model places Solana in a range between $90.02 and $121.51. The central expected value sits at $109.95, but this is not a price target, rather the midpoint of a broad probability distribution.
The width of that range matters: it reflects the high uncertainty that follows a sharp sell-off like the current one. In the conservative case, the model still implies an upside of about 23.2% from current levels, while the optimistic case would correspond to roughly 66.3%. Both scenarios would require the market to first stabilize before any sustained recovery becomes plausible.
What could happen now?
Bullish scenario
For a bullish shift, SOL would first need to reclaim the primary resistance at $88.50 on sustained volume. That would put the 200-day average at $88.90 back into reach and meaningfully weaken the current downtrend narrative. For such a move to carry weight, the RSI should lift out of oversold without immediately overheating, and MACD would need to flatten and turn higher. In the short term, bulls would also need to defend the $73.70 zone as a hold condition, otherwise any attempt at recovery loses its base.
Trigger: > $88.50 with elevated volume
Bearish scenario
The bearish case is already partly in motion: the primary support at $77.60 has broken, and the key level that must not give way now is $73.70. A decisive move below that zone would open up the downside with no obvious technical anchor nearby and keep MACD firmly in negative territory. Volume above the 30-day average would then act as confirmation that sellers remain in charge rather than exhausting themselves. In that case, the medium-term trend, already pressured by SOL trading 30% below its 50-day average, would come under even more strain.
Trigger: < $73.70
Conclusion: $73.70 level decides the direction
The technical setup is clearly weak, but the extreme RSI reading at 23 shows just how stretched the move has become. The decisive area is the $73.70 zone, directly below the current price.
If buyers defend this level and SOL can work its way back above $88.50, the picture would start to brighten noticeably. If $73.70 breaks on continued above-average volume, the path of least resistance remains lower and the medium-term trend weakens further. The next few trading days are likely to set the direction.
Want to buy Solana? Kraken is our recommended crypto trading platform.
Continue to KrakenSince 2017, Philipp Duringer has been deeply involved in Bitcoin, crypto assets and digital financial markets. As the founder of Coinbird, he combines years of crypto experience with more than 15 years of technical experience in IT and digital products. His goal is to make crypto easier to understand, more transparent and easier to compare.
About the authorAI-assisted: This price analysis is generated automatically based on structured market data and reviewed through defined quality rules. It is for informational purposes only and is not financial or investment advice or a recommendation to buy or sell crypto assets.