
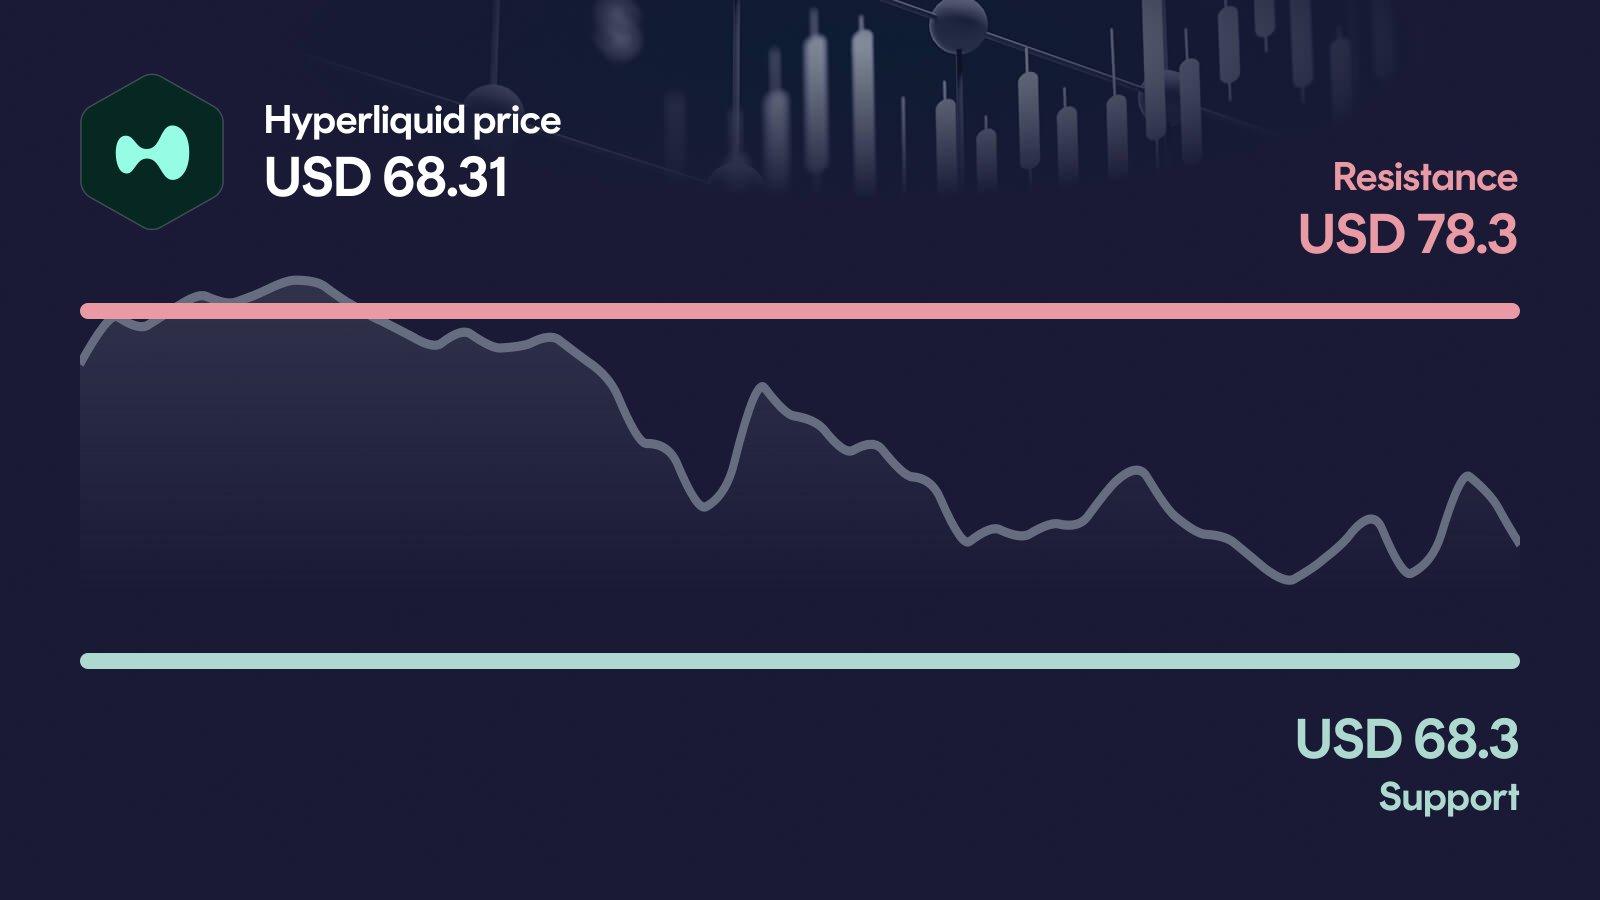
Hyperliquid is under pressure. HYPE has dropped 7.7% in 24 hours and is now trading right on its primary support at $68.30, with the 200-day moving average sitting just below. If this zone cracks, the next reference is $63.90 and the path back toward the monthly low opens up.
Key takeaways in a nutshell
Support under siege: HYPE trades at $68.31 after a 7.7% daily drop, pressing directly against the $68.30 primary support.
Trend turning fragile: Price sits 17.9% below the 50-day average ($83.20) and only 0.7% below the 200-day ($68.80), a knife-edge setup.
Decision zone $68: The $68.30 support and $78.30 resistance frame the entire short-term setup, with no room for drift.
RSI near oversold: RSI at 36 signals clear weakness but leaves room before a classical oversold reading at 30.
AI sees 2026 upside: The AI forecast model projects a 2026 range of $85.60 to $121.50, well above current spot.
What happened to the Hyperliquid price?
Hyperliquid is trading at $68.31 after losing 7.7% in the last 24 hours. The drop has pushed HYPE straight onto its primary support at $68.30 and is only fractionally above the 200-day moving average at $68.80. That makes the current candle one of the most important of the past month.
Over the last 7 days, HYPE is down 12.3%, and the 30-day picture is hardly better at -13.6%. The daily volume of roughly $967 million is close to the 30-day average, so this move is not driven by a panic spike, but by persistent selling. The weekly high at $79.60 now feels far away.
Key price levels for Hyperliquid
The first resistance sits at $78.30, and only a clean reclaim would unlock a path back toward $84 and the 50-day average near $83.20. Support at $68.30 is the line in the sand: it aligns almost perfectly with the 200-day moving average, making it a technical zone that bulls cannot afford to concede. If it fails, the next orientation is $69.50 as a fast retest level, followed by the secondary support at $63.90.
Hyperliquid indicators: RSI, MACD and volume
The three indicators currently paint a consistent, bearish-leaning picture. The RSI at 36 reflects clear weakness and moves closer to the oversold zone, without having reached it yet. The MACD is bearish at -2.63, and the negative histogram trend over the past several readings confirms that momentum is still deteriorating. Volume at 3.5% below the 30-day average is unremarkable, meaning sellers are in control without needing extraordinary pressure. Taken together, the picture is one of controlled weakness, not capitulation, which keeps the $68.30 test credible but fragile.
Relative Strength Index
MACD
AI forecast for Hyperliquid
Looking toward year-end 2026, our AI forecast model places Hyperliquid in a range between $85.63 and $121.51. The central expected value lands at $104.58, but this is not a price target: it is the midpoint of a broad probability distribution. In other words, the model does not predict exactly this number, but considers it the statistically most plausible center.
The width of the range matters more than the midpoint. Even the conservative lower bound would imply about 24.6% upside from current levels, while the optimistic end translates to roughly 76.7%. That gap underlines the uncertainty the model embeds, and it stands in sharp contrast to the short-term weakness HYPE is showing right now.
What could happen now?
Bullish scenario
The bullish case needs a decisive reclaim of the $78.30 resistance, ideally backed by volume clearly above the 30-day average. Such a move would ease the pressure on the 200-day moving average and reopen the path toward the $84 zone, where the 50-day average aligns. For the setup to stay intact, the RSI should recover from current oversold-leaning levels without immediately overheating, and the MACD histogram would need to turn upward again. Crucially, HYPE must not lose the $68.30 support in the meantime, otherwise any rebound attempt loses its structural base.
Trigger: > $78.30 with elevated volume
Bearish scenario
The bearish scenario triggers on a confirmed break below $68.30, which would also send price under the 200-day moving average at $68.80. In that case, the next reference level is $69.50 as a fast retest zone, followed by secondary support at $63.90. A loss of $63.90 would put the broader trend structure at serious risk, as the buffer back toward the monthly low would essentially vanish. The already bearish MACD and weak RSI leave little room for error in defending the current zone.
Trigger: < $68.30
Conclusion: $68.30 support decides the direction
The technical setup is fragile, but not yet broken. The decisive area is the $68.30 support, reinforced by the 200-day moving average just beneath it.
A reclaim of $78.30 would shift the short-term narrative and put the 50-day average back in play. A clean break of $68.30, however, would open the way toward $63.90 and put pressure on the medium-term trend structure. With RSI at 36, a bearish MACD and only average volume, the balance currently tilts to the downside. The next few trading days are likely to set the direction.
Want to buy Hyperliquid? Kraken is our recommended crypto trading platform.
Continue to KrakenSince 2017, Philipp Duringer has been deeply involved in Bitcoin, crypto assets and digital financial markets. As the founder of Coinbird, he combines years of crypto experience with more than 15 years of technical experience in IT and digital products. His goal is to make crypto easier to understand, more transparent and easier to compare.
About the authorAI-assisted: This price analysis is generated automatically based on structured market data and reviewed through defined quality rules. It is for informational purposes only and is not financial or investment advice or a recommendation to buy or sell crypto assets.