
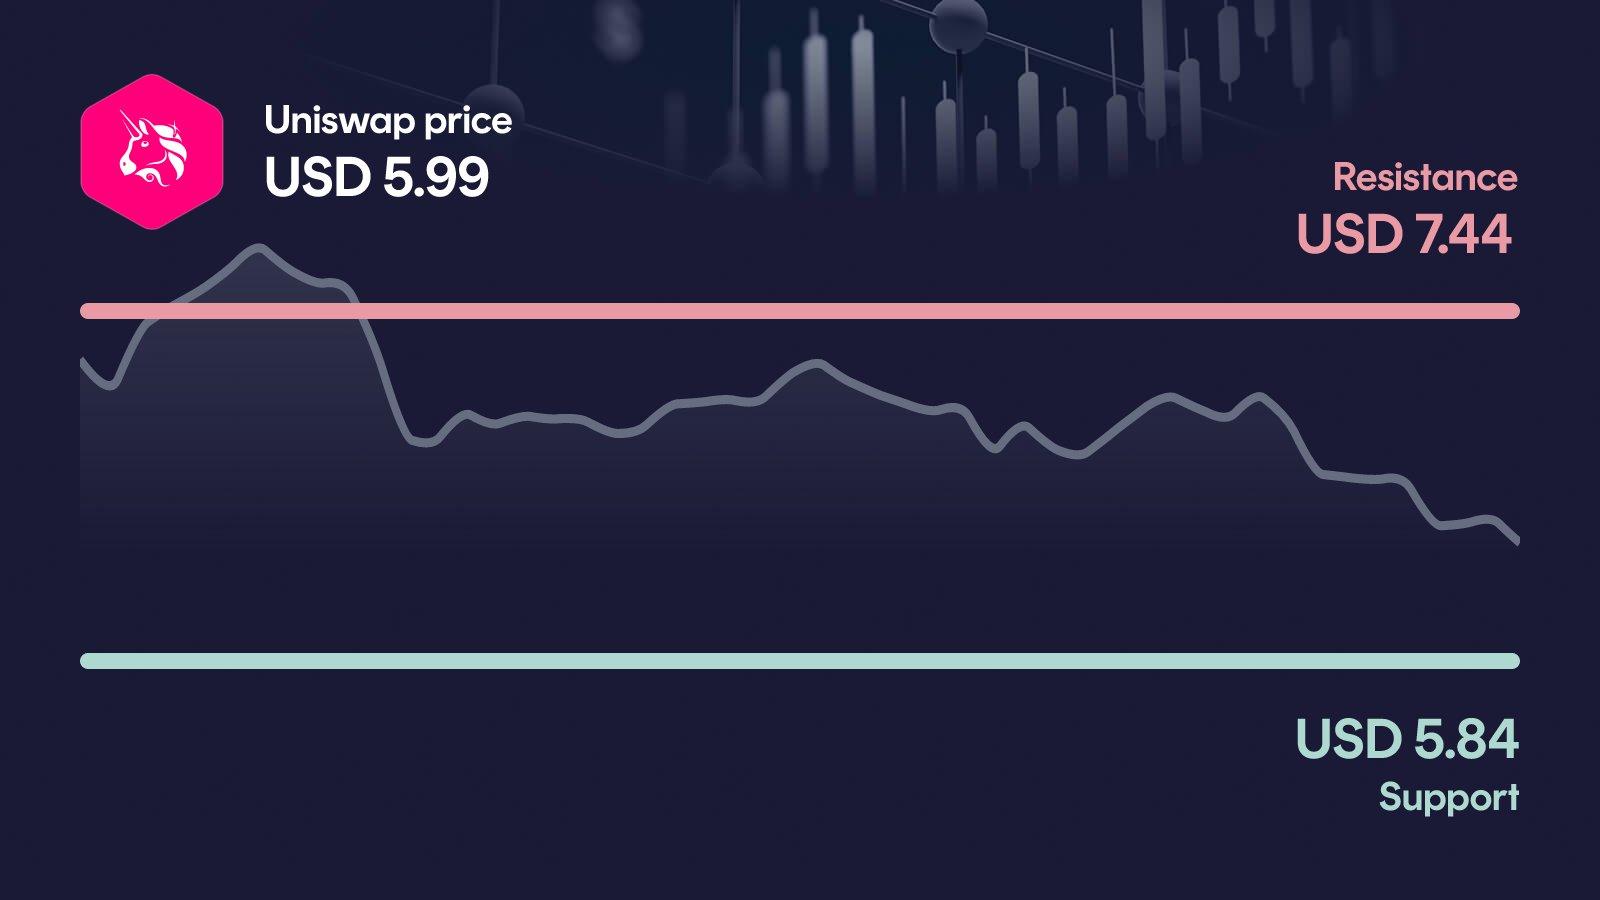
Uniswap is under heavy pressure: UNI drops more than 9% in 24 hours and is pressing directly against the key support zone around $5.84. MACD has turned bearish and RSI is drifting toward weakness, while the 50-day average sits far above the current price. Now the question is whether bulls can defend this level or whether the next downside leg toward $5.07 begins.
Key takeaways in a nutshell
Sharp daily drop: UNI trades at $5.99 after a 9.4% slide in 24 hours, with the weekly performance at -12.7%.
Trend split: Price sits 23% below the 50-day average ($7.78) but still 22% above the 200-day average ($4.90).
Support on the line: The $5.84 zone is the decisive line in the sand, with $5.07 as the next downside reference.
Momentum cooling: RSI at 43 shows clear weakness without being oversold, while MACD has flipped bearish.
AI model constructive: For year-end 2026, the AI model places UNI in a range of $7.03 to $8.58, well above current levels.
What happened to the Uniswap price?
Uniswap is trading at $5.99 after a sharp 9.4% drop in the last 24 hours. The move pushes UNI directly onto its primary support zone at $5.84 and extends a weak phase that has now cost the token 12.7% over the week and 20.3% over the last 30 days.
The weekly high at $7.80 feels suddenly distant, and the monthly low at $6.23 has already been undercut. 24h volume of $525M is only 17% above the 30-day average, which is notable: this is a strong sell-off, but not a panic flush with extreme turnover.
Key price levels for Uniswap
The primary resistance sits at $7.44; a reclaim would reopen the path toward $7.83 and relieve the current downside pressure. Below the market, the key support is $5.84, exactly the zone currently being tested, and the only real cushion between the spot price and deeper levels. If this floor breaks on a daily close, the next relevant reference is $5.07, where the secondary support would have to prove itself.
Uniswap indicators: RSI, MACD and volume
The three indicators currently paint a consistent picture, and it leans bearish. The RSI at 43 shows clear loss of momentum without being technically oversold, meaning there is still room for further downside before any mechanical bounce. MACD has turned negative at -0.16 with a recent bearish crossover, confirming that short-term momentum has rolled over. Volume at 17% above the 30-day average is classified as average: notable on a down day, but not the kind of capitulation that typically marks a bottom. Taken together, the indicators argue for caution as long as $5.84 is not clearly defended.
Relative Strength Index
MACD
AI forecast for Uniswap
Looking toward year-end 2026, our AI forecast model places Uniswap in a range between $7.03 and $8.58. The central expected value sits at $7.77, but this is not a price target: it is the midpoint of a broad probability distribution and should be read as such.
The width of the range is the actually interesting part, because it reflects how much room UNI has above current levels if the broader setup stabilizes. In the conservative case, the model implies roughly +17.2% from the current price, while the optimistic case points to around +43.2%. Even the lower bound would require UNI to defend its current support and work back above the 50-day average.
What could happen now?
Bullish scenario
A bullish setup would require UNI to first stabilize at $5.84 and then reclaim $7.44 on a daily close with visibly higher volume. That would break the current pattern of lower highs and bring the next orientation level at $7.83 into focus. RSI would have room to expand upward from 43 without immediately overheating, and a MACD flip back above the zero line would confirm the shift. The key condition: $5.84 must not be lost again once it is defended.
Trigger: > $7.44 with elevated volume
Bearish scenario
The bearish case triggers on a daily close below $5.84. In that scenario, the short-term setup clearly deteriorates: momentum stays negative, MACD extends its bearish signal and the next reference level becomes $5.07. A break of that secondary support would open a far more uncomfortable picture and bring the gap to the 200-day average at $4.90 into play. At that point, the medium-term trend would also be under serious pressure for the first time.
Trigger: < $5.84
Conclusion: $5.84 decides the direction
The technical setup is fragile, but not yet broken, as the 200-day average at $4.90 still sits well below current prices. The decisive area is the support zone at $5.84, where UNI is being tested right now.
A defense of this level combined with a reclaim of $7.44 would quickly brighten the picture and put the AI model's range back within reach. A clean break below $5.84, on the other hand, exposes $5.07 as the next relevant level and would shift the discussion toward the 200-day average. The next few trading days are likely to set the direction.
Want to buy Uniswap? Kraken is our recommended crypto trading platform.
Continue to KrakenSince 2017, Philipp Duringer has been deeply involved in Bitcoin, crypto assets and digital financial markets. As the founder of Coinbird, he combines years of crypto experience with more than 15 years of technical experience in IT and digital products. His goal is to make crypto easier to understand, more transparent and easier to compare.
About the authorAI-assisted: This price analysis is generated automatically based on structured market data and reviewed through defined quality rules. It is for informational purposes only and is not financial or investment advice or a recommendation to buy or sell crypto assets.