


What is the Relative Strength Index (RSI)?
The Relative Strength Index (RSI) is a momentum indicator. It shows how strong recent upward price movements have been relative to recent downward movements. The RSI always ranges from 0 to 100.
A high RSI shows that upward movements have recently outweighed downward movements. A low RSI shows that downward movements have outweighed upward movements.
Important: The RSI measures price momentum, not Bitcoin’s fundamental value. A high RSI therefore does not automatically mean that Bitcoin is overvalued or that the price is about to fall.
How are RSI values interpreted?
The classic RSI interpretation focuses mainly on the 30 and 70 thresholds. Values of 70 or above are considered overbought and may indicate an overheated market. Values of 30 or below are considered oversold and may point to a potential rebound. For a more detailed classification, we use five ranges on Coinbird.
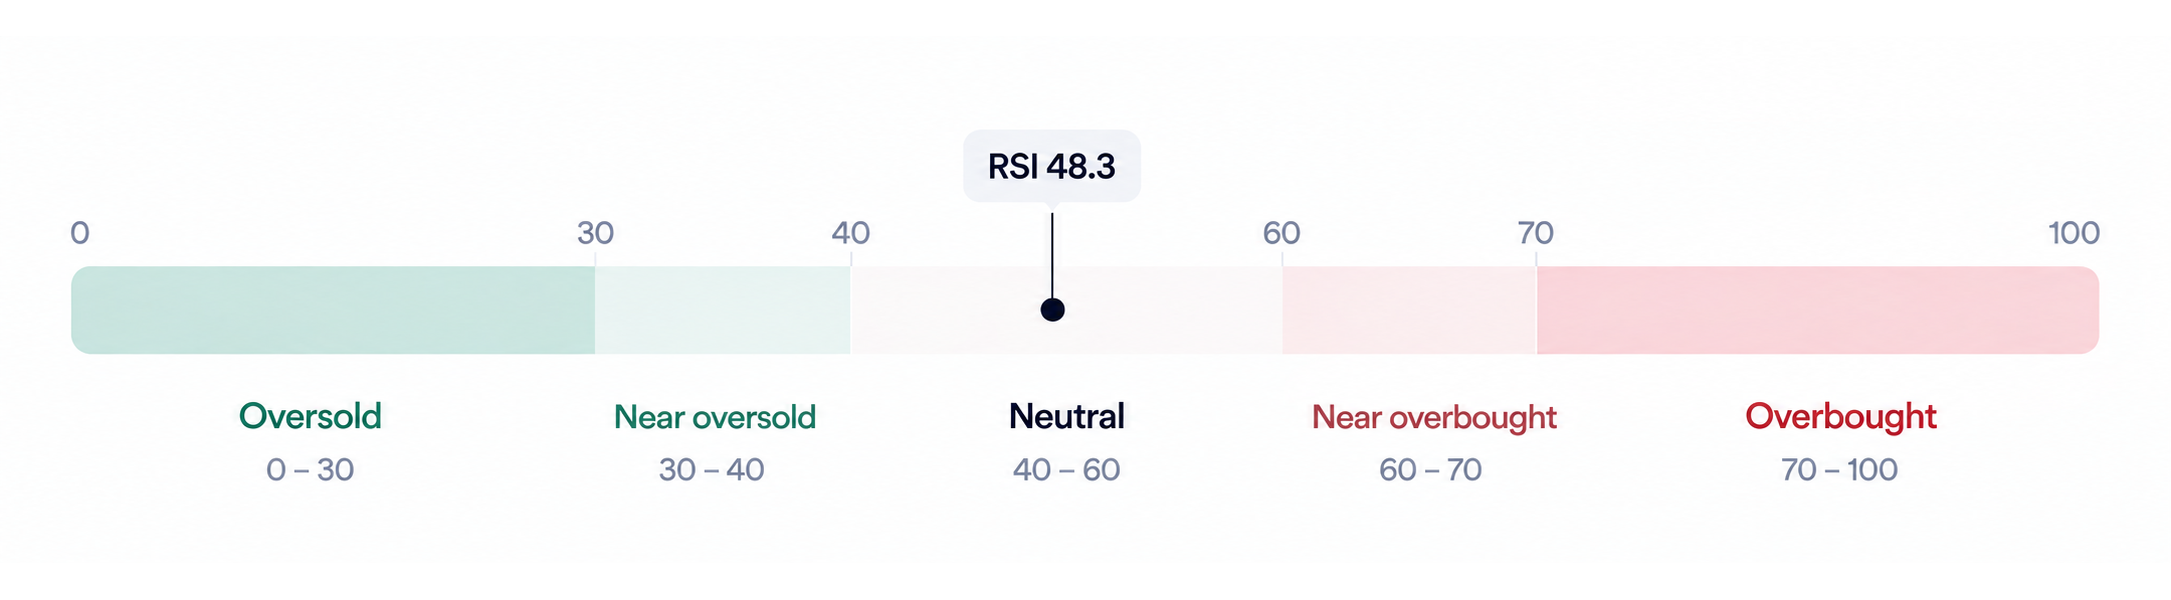
30 or below: Oversold
Strong downward momentum; possible rebound, sometimes interpreted as a buy signal.Above 30 to under 40: Near oversold
Downward momentum; the RSI is approaching the oversold range.40 to under 60: Neutral
Balanced momentum.60 to under 70: Near overbought
Upward momentum; the RSI is approaching the overbought range.70 or above: Overbought
Strong upward momentum; possible overheating, sometimes interpreted as a sell signal.
The additional ranges between 30 and 40 and 60 and 70 provide a more granular classification. An RSI around 50 is roughly in the middle of the scale. As the RSI moves significantly above 50, positive momentum increases. As it falls significantly below 50, negative momentum becomes stronger.
Overbought and oversold conditions can be interpreted as potential sell or buy signals. However, they are not reliable trading signals on their own.
What does RSI(14) mean and what timeframes are available?
The number in RSI(14) refers to the indicator’s period length. On our RSI page, we always use 14 candles. The amount of time those 14 periods cover depends on the selected timeframe, so RSI(14) does not automatically mean 14 days. In the chart, you can switch between 4-hour, daily and weekly candles.
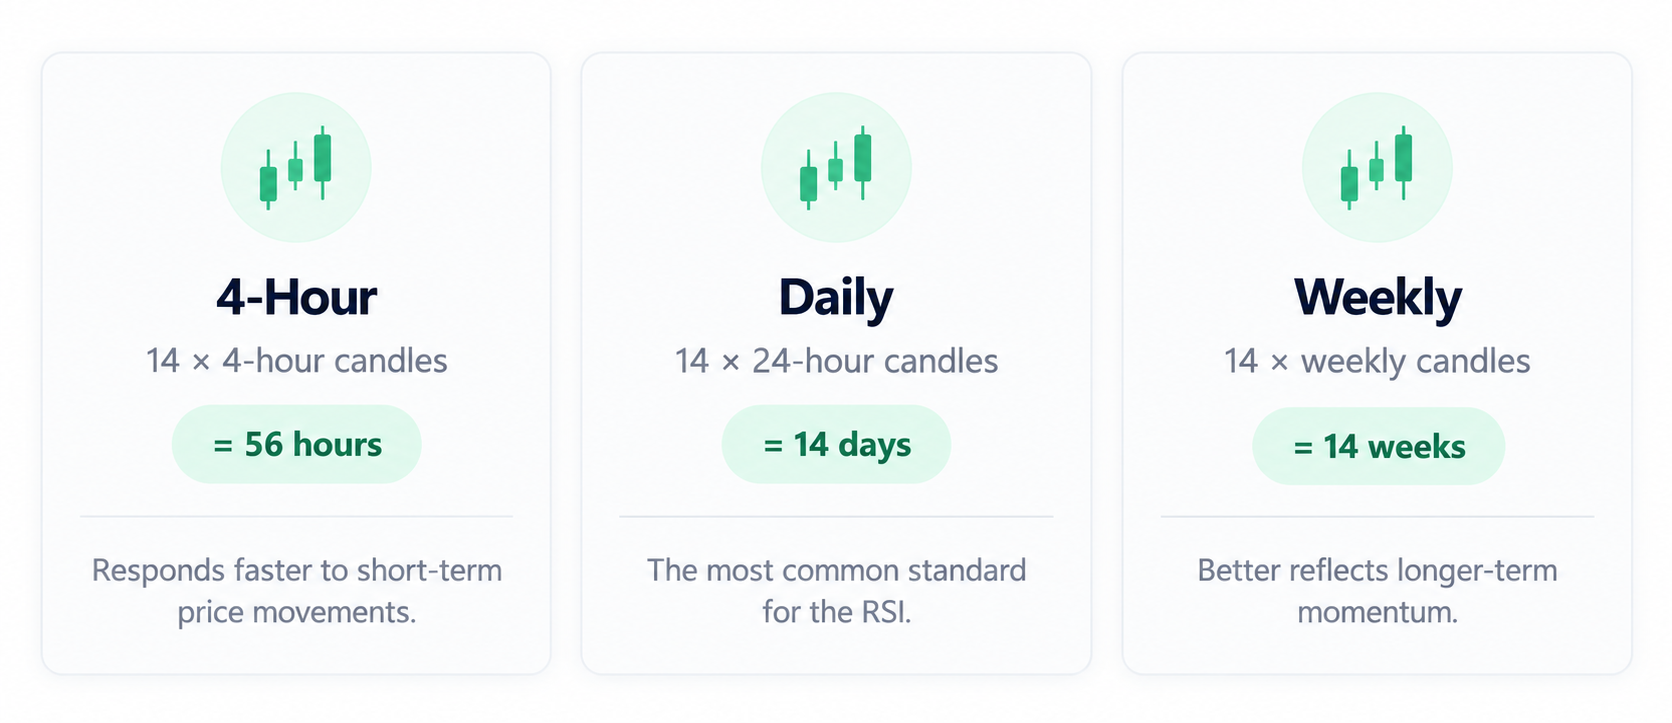
The RSI reacts differently to price movements depending on the timeframe:
4-hour RSI: Reacts faster to short-term price movements and reaches extreme values more frequently.
Daily RSI: Reacts more gradually and reflects medium-term momentum.
Weekly RSI: Changes more slowly and reflects longer-term market movements.
Bitcoin can therefore already be overbought on the 4-hour timeframe while the daily RSI remains neutral. Both readings can be correct at the same time. For our main RSI reading, we use RSI(14) based on 24-hour candles.
How is the RSI calculated?
The RSI is calculated using price changes between consecutive candles. Upward and downward movements are measured separately.
For our calculation, we use the closing price of each candle. Average gains and losses are then smoothed using the method introduced by RSI creator J. Welles Wilder. This means earlier price movements continue to influence the calculation, but with decreasing weight.
The Relative Strength (RS) is calculated first:
RS = average gain ÷ average loss
The Relative Strength is then converted to a scale from 0 to 100:
RSI = 100 − [100 ÷ (1 + RS)]
The stronger the average upward movements are relative to downward movements, the higher the RSI rises. If downward movements dominate, the RSI falls.
Is an overbought RSI a sell signal?
Not automatically. An RSI above 70 primarily indicates very strong positive momentum. During strong uptrends, Bitcoin can remain overbought for an extended period without a major correction immediately following.
The same applies in reverse to an RSI below 30. An oversold market can continue falling before momentum eventually turns.
The RSI should therefore not be used in isolation as a buy or sell signal, but rather as an additional indicator for assessing market momentum.
What are RSI divergences?
An RSI divergence occurs when price and the RSI move in different directions.
Bullish RSI divergence: The price makes a new low while the RSI forms a higher low. This can indicate that negative momentum is weakening.
Bearish RSI divergence: The price makes a higher high while the RSI forms a lower high. This can indicate that positive momentum is weakening.

Since 2017, Philipp Duringer has been deeply involved in Bitcoin, crypto assets and digital financial markets. As the founder of Coinbird, he combines years of crypto experience with more than 15 years of technical experience in IT and digital products. His goal is to make crypto easier to understand, more transparent and easier to compare.
About the author