
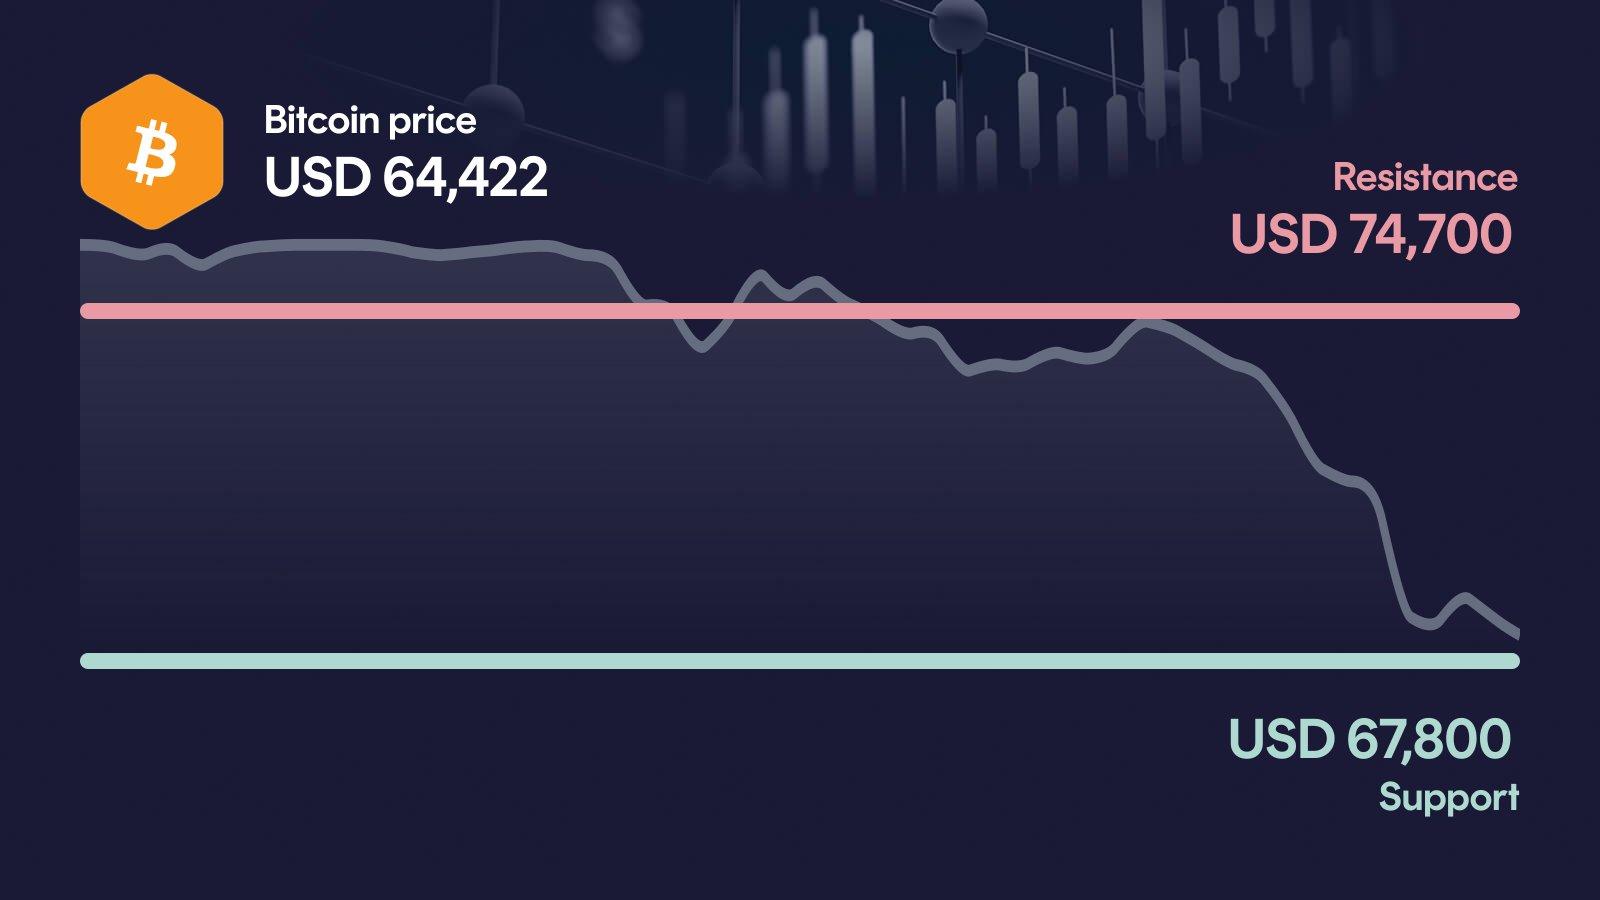
Bitcoin is under heavy pressure: BTC has dropped more than 5% in 24 hours to $64,422, extending a brutal 14% weekly slide. The RSI at 30 signals an oversold market, while MACD remains clearly bearish and volume is running 43% above the 30-day average. Now everything hinges on the $64,400 secondary support: if it breaks, the next downside reference opens up quickly.
Key takeaways in a nutshell
Sell-off deepens: Bitcoin trades at $64,422 after a 5.7% daily drop and a 14.8% weekly slide, with heavy volume fueling the move.
Trend clearly broken: BTC sits more than 20% below the 50-day average at $80,900 and nearly 12% under the 200-day line at $73,100.
Support on the edge: The $64,400 secondary support is being tested directly; a clean break would remove the last cushion above $71,100 as the next upside reference.
RSI at the floor: With an RSI reading of 30, momentum is deeply oversold, but there is no sign yet of a stabilizing turn.
AI sees recovery room: The AI forecast model projects a 2026 range between $73,130 and $133,252, with a midpoint of $98,716.
What happened to the Bitcoin price?
Bitcoin is caught in an aggressive sell-off: BTC trades at $64,422, down 5.7% in 24 hours and 14.8% over the past week. The pressure extends further out, with a 21.4% loss over 30 days and a drawdown of nearly 49% from the all-time high at $126,100.
What stands out is the volume: $39.9 billion in 24-hour turnover is 43% above the 30-day average, a clear sign that this move is being carried by conviction rather than thin flows. Bitcoin is now trading right at its monthly low, with the weekly low of $67,800 already broken.
Key price levels for Bitcoin
On the upside, the first resistance sits at $74,700; only a reclaim of this area would start to repair the broken short-term structure, with $78,100 as the next hurdle above. On the downside, the primary support at $67,800 has already given way, leaving the $64,400 secondary support as the final line in the current range. If that level breaks on a daily close, the next relevant downside orientation opens toward the lower wide-range zone, with no fresh demand visible until bulls can push price back above $71,100.
Bitcoin indicators: RSI, MACD and volume
The three indicators currently paint a consistent bearish picture, though with a nuance worth noting. The RSI at 30 marks the classic oversold threshold, which often precedes at least a technical bounce but is not a reversal signal on its own. The MACD is firmly bearish at -2,116, and the histogram shows no sign of narrowing, which confirms that downside momentum remains intact. Volume at 43% above the 30-day average underlines the seriousness of the move: sellers are active, not just hesitant buyers stepping aside. Taken together, the setup suggests a market in capitulation mode, where oversold conditions and heavy selling coexist.
Relative Strength Index
MACD
AI forecast for Bitcoin
Looking toward year-end 2026, our AI forecast model places Bitcoin in a wide range between $73,130 and $133,252. The central expected value sits at $98,716, but this should not be read as a price target; it is the midpoint of a broad probability distribution that reflects today's elevated uncertainty.
The width of this corridor matters: it signals that the model sees both a plausible path back above previous highs and the risk of an extended stabilization phase. In the conservative case, that translates into an upside of around 13.4% from current levels, while the optimistic case points to a potential move of roughly 106.6%. Whether Bitcoin trends toward the upper or lower half of that range will depend on how the current support test resolves.
What could happen now?
Bullish scenario
A credible recovery would require Bitcoin to first reclaim the $67,800 area that just broke and then push back toward the primary resistance at $74,700. A daily close above that level on strong volume would be the first serious sign that the sell-off has exhausted itself and that buyers are stepping back in. For such a move to hold, the RSI would need to climb out of oversold territory without immediately overheating, and the MACD histogram should start narrowing meaningfully. Crucially, the $64,400 support must not be lost in the process, otherwise any bounce risks fading into another lower high.
Trigger: > $74,700 with elevated volume
Bearish scenario
The decisive level on the downside is $64,400: a daily close below this secondary support would confirm that the entire $67,800 zone has flipped from floor to ceiling. The short-term setup would deteriorate further, with the MACD still deeply bearish and volume already elevated, suggesting sellers have the bandwidth to extend the move. Below $64,400, there is no clearly defined demand zone in the current data until price would need to rebuild the structure from lower levels. In that case, the already broken trend against the 200-day average at $73,100 would move further out of reach, putting additional pressure on the medium-term picture.
Trigger: < $64,400
Conclusion: $64,400 level decides the direction
The technical setup is clearly weak, but the oversold RSI and the heavy volume suggest the market is approaching a point where a short-term reaction becomes more likely. The decisive area is the $64,400 support, which now sits directly under current price.
If Bitcoin defends this level and manages to reclaim $67,800, a relief move toward the $74,700 resistance comes into play. If $64,400 breaks on a daily close, the last structural cushion disappears and the sell-off has room to extend, with $71,100 turning into distant overhead resistance. The next few trading days are likely to set the direction.
Want to buy Bitcoin? Kraken is our recommended crypto trading platform.
Continue to KrakenSince 2017, Philipp Duringer has been deeply involved in Bitcoin, crypto assets and digital financial markets. As the founder of Coinbird, he combines years of crypto experience with more than 15 years of technical experience in IT and digital products. His goal is to make crypto easier to understand, more transparent and easier to compare.
About the authorAI-assisted: This price analysis is generated automatically based on structured market data and reviewed through defined quality rules. It is for informational purposes only and is not financial or investment advice or a recommendation to buy or sell crypto assets.