
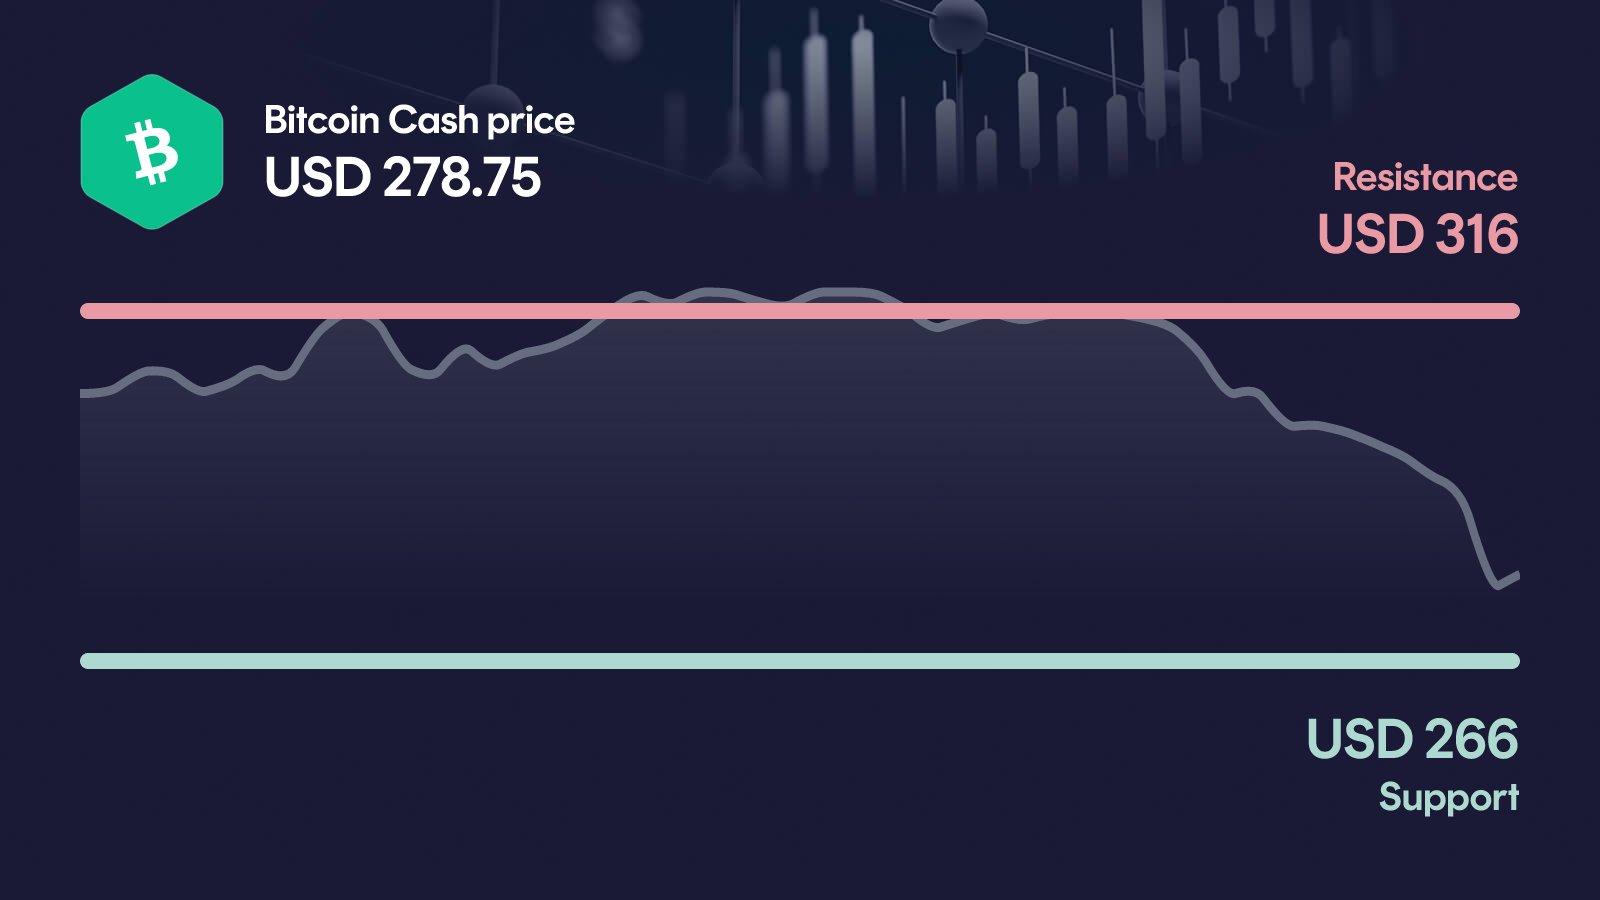
Bitcoin Cash is under pressure. BCH has slid almost 7% in a single day to around $278 and is now hovering just above the key support zone near $266. If this level breaks, the chart loses its last line of defense before much lower territory comes into play.
Key takeaways in a nutshell
Sharp daily drop: BCH trades at $278.75 after a 6.96% slide in 24 hours, pulling the weekly performance into the red at -9.34%.
Trend split: Price sits 2.48% above the 50-day average at $272 but still 8.61% below the 200-day average at $305, signaling an unresolved mid-term downtrend.
Decisive zone: The $266 support is the key battleground. A clean break opens the door toward the monthly low near $213.
Momentum fading: RSI at 53 is neutral, but the MACD histogram has flipped negative, confirming that short-term momentum is turning down.
AI range for 2026: The AI forecast model projects a year-end 2026 range between $298 and $492, with a midpoint around $383.
What happened to the Bitcoin Cash price?
Bitcoin Cash is taking a clear hit. BCH has dropped 6.96% in the last 24 hours to $278.75, erasing most of the recent recovery and dragging the weekly performance to -9.34%. The weekly low at $270 is already uncomfortably close to the price, while the weekly high of $322 now feels far away.
The broader context is still mixed: over 30 days BCH is up 7.93% and over 60 days nearly 29%, so the current slide looks more like a sharp pullback inside a recovery than a full trend break. Notable, however, is the volume picture: 24h turnover of $283 million sits almost exactly at the 30-day average, meaning this drop is happening without panic selling, but also without a visible defensive bid.
Key price levels for Bitcoin Cash
On the upside, the first serious hurdle sits at $316: only a reclaim of this zone would neutralize the current sell signal and put the weekly high at $322 and the secondary resistance at $332 back in play. On the downside, everything now revolves around $266, which lines up almost perfectly with the weekly low at $270 and marks the last defensive zone before the chart opens up. If that support fails, the next relevant orientation point is the monthly low near $213, a drop that would clearly change the medium-term picture.
Bitcoin Cash indicators: RSI, MACD and volume
The three indicators currently paint a mixed but slightly bearish picture. The RSI at 53 is neutral and leaves room in both directions, so it is neither confirming a reversal nor warning of exhaustion. The MACD, however, is turning: the signal has flipped bearish, and the histogram has rolled from clearly positive values into negative territory, which confirms that short-term momentum has shifted. Volume at roughly 0.6% below the 30-day average is simply average, meaning the sell-off is orderly rather than driven by capitulation. Together, this suggests weakening momentum into a critical support test, without the kind of panic flow that typically marks a bottom.
Relative Strength Index
MACD
AI forecast for Bitcoin Cash
Looking toward year-end 2026, our AI forecast model places Bitcoin Cash in a range between $298.87 and $492.75. The central expected value sits at around $383.75, which should not be read as a price target but rather as the midpoint of a broad probability distribution.
The width of this range is the real message: it reflects how much the outcome depends on whether BCH defends its current support structure or slips into a deeper correction first. In the conservative case, the model implies roughly +7.68% from the current price, while the optimistic case points to about +77.54%. That spread shows a constructive long-term bias, but also acknowledges meaningful downside risk in the short term.
What could happen now?
Bullish scenario
The bullish case needs a clear reclaim of the $316 resistance zone on noticeably higher volume. That would put the weekly high at $322 and the secondary resistance at $332 back on the table and shift the short-term structure from defensive to constructive. For the move to be credible, the MACD histogram would have to turn positive again, while the RSI should rise without pushing into overbought territory. Just as important, BCH would need to hold above $266 on any pullback, otherwise the setup falls back into neutral at best.
Trigger: > $316 with elevated volume
Bearish scenario
The bearish case activates on a daily close below $266. That would confirm the loss of the current support band and align with the already bearish MACD signal, likely dragging the 50-day average at $272 down with it. The next relevant reference on the downside is the monthly low near $213, a level that would represent a clear structural setback. A sustained move below $266 would also widen the gap to the 200-day average at $305 and keep the medium-term trend firmly under pressure.
Trigger: < $266
Conclusion: $266 support decides the direction
The technical setup is fragile but not broken, with momentum rolling over just as price approaches a critical zone. The decisive area is the band around $266, where the weekly low and primary support overlap.
If BCH defends this zone and reclaims $316, the recent 30- and 60-day strength can be reactivated and the picture turns constructive again. If $266 breaks on a daily close, the path toward the $213 region opens up and the 200-day average at $305 moves further out of reach. The next few trading days are likely to set the direction.
Want to buy Bitcoin Cash? Kraken is our recommended crypto trading platform.
Continue to KrakenSince 2017, Philipp Duringer has been deeply involved in Bitcoin, crypto assets and digital financial markets. As the founder of Coinbird, he combines years of crypto experience with more than 15 years of technical experience in IT and digital products. His goal is to make crypto easier to understand, more transparent and easier to compare.
About the authorAI-assisted: This price analysis is generated automatically based on structured market data and reviewed through defined quality rules. It is for informational purposes only and is not financial or investment advice or a recommendation to buy or sell crypto assets.