
Avalanche is under heavy selling pressure, with AVAX dropping more than 9% in 24 hours and dipping below the $10.80 support. MACD has flipped bearish while RSI remains elevated near 69, a mix that signals exhaustion after the strong 30-day rally. Now the question is whether the $10 zone holds or the correction deepens.
Key takeaways in a nutshell
Sharp daily drop: AVAX trades at $10.18 after losing 9.3% in 24 hours, slipping below the $10.80 support zone.
Trend still intact: Despite the pullback, price remains 17% above the 50-day average ($8.70) and 25% above the 200-day average ($8.10).
Decision at $10: The $10 secondary support is now the key line; below it, the setup opens toward much lower levels.
Momentum cooling: RSI at 69 shows the recent rally ran hot, and the MACD has just turned bearish after weeks of positive readings.
AI sees upside into 2026: Our AI model projects a range of $11.59 to $16.44 for year-end 2026, with an average of $14.15.
What happened to the Avalanche price?
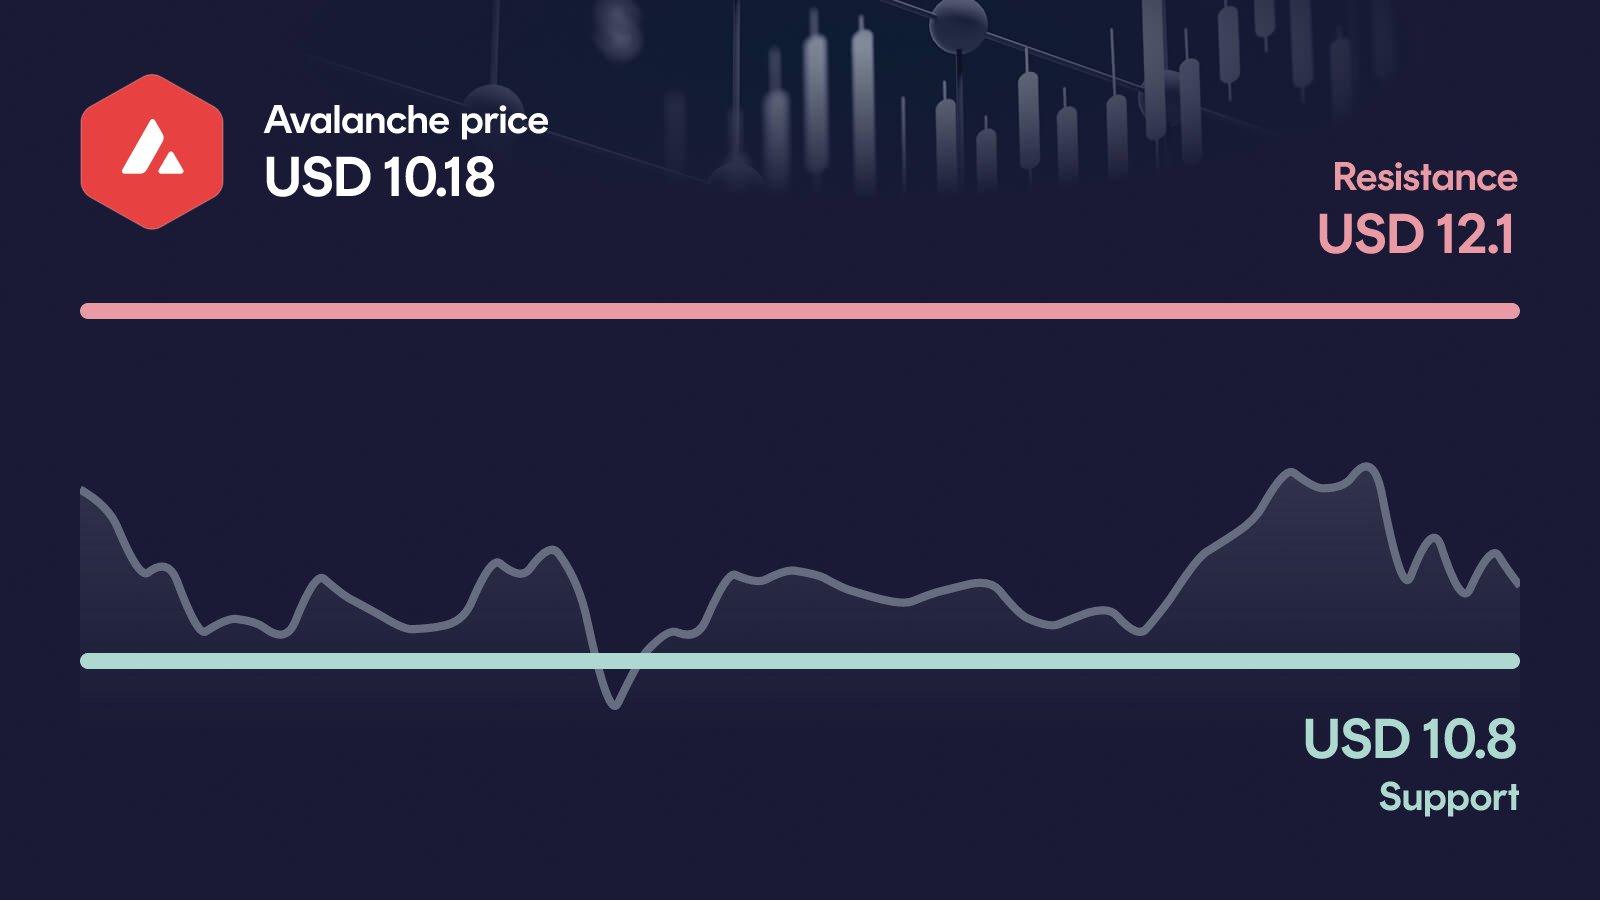
Avalanche is taking a hard hit. AVAX dropped 9.3% in the last 24 hours to $10.18, slicing through the $10.80 support and pulling the 7-day performance into the red at -7.5%. The weekly high at $11.70 now feels distant, and the move looks like the first serious correction after a powerful run.
The bigger picture, however, is less dramatic than the daily candle suggests. Over 30 days AVAX is still up more than 27%, and 60-day performance stands at an impressive +55%. Volume at $580 million came in roughly 10% above the 30-day average: elevated, but not panic-level selling.
Key price levels for Avalanche
The first resistance now sits at $12.10, and only a reclaim of this zone would neutralize the current breakdown and put the $12.50 area back on the radar. On the downside, the broken $10.80 level flips into immediate resistance, which makes the $10.00 secondary support the critical line in the sand. If $10 fails, there is no meaningful technical reference until the monthly low near $7.18.
Avalanche indicators: RSI, MACD and volume
The three indicators currently paint a mixed but cautionary picture. RSI sits at 69, close to overbought territory, which explains why the market needed to let off steam after the 55% two-month rally. The MACD has just flipped to a bearish signal with the histogram turning negative, confirming that short-term momentum has rolled over. Volume at roughly 10% above the 30-day average is elevated but not extreme, so the sell-off is real but not yet capitulation. Together, the readings suggest a healthy pullback for now, but one that could gain speed if $10 breaks.
Relative Strength Index
MACD
AI forecast for Avalanche
Looking toward year-end 2026, our AI forecast model places AVAX in a range from $11.59 to $16.44. The central expected value sits at $14.15, which is not a price target, but the midpoint of a broad probability distribution.
The span itself matters more than the single number: it reflects how wide the realistic outcomes remain in a market still digesting a strong rally. In the conservative case, AVAX would gain about 14% from the current level, while the optimistic case points to roughly 62% upside. The current correction fits comfortably within that distribution and does not break the longer-term thesis, as long as the key supports hold.
What could happen now?
Bullish scenario
For the bulls to regain control, AVAX needs to reclaim $10.80 quickly and then push back through the $12.10 resistance on rising volume. A clean move above this level would turn the current drop into a shakeout and open the path toward $12.50. Ideally, RSI would cool slightly below 70 to avoid an immediate overbought signal, while the MACD histogram would need to flip back into positive territory. As long as the $10 zone is not lost again, the broader uptrend built on the 50- and 200-day averages remains intact.
Trigger: > $12.10 with elevated volume
Bearish scenario
The decisive line now is $10.00: a daily close below it would confirm the breakdown that started with today's drop. In that case, the 10% pullback could extend quickly, as there is no major technical reference between $10 and the monthly low near $7.18. A bearish MACD combined with fading momentum would amplify the pressure, and even the 50-day average at $8.70 could come back into play. A deeper slide toward that zone would seriously dent the medium-term trend that has defined AVAX over the past two months.
Trigger: < $10.00
Conclusion: $10 level decides the direction
The technical setup is mixed, but still constructive on the higher timeframes thanks to a 50-day average well below current price. The decisive area is the $10.00 to $10.80 zone, where the short-term fight will be settled.
If AVAX stabilizes above $10 and reclaims $10.80, the pullback looks like a healthy reset within an intact uptrend. If $10 breaks, the door opens toward much lower levels with little support in between, and the bullish momentum of the past weeks would be seriously questioned. The next few trading days are likely to set the direction.
Want to buy Avalanche? Kraken is our recommended crypto trading platform.
Continue to KrakenSince 2017, Philipp Duringer has been deeply involved in Bitcoin, crypto assets and digital financial markets. As the founder of Coinbird, he combines years of crypto experience with more than 15 years of technical experience in IT and digital products. His goal is to make crypto easier to understand, more transparent and easier to compare.
About the authorAI-assisted: This price analysis is generated automatically based on structured market data and reviewed through defined quality rules. It is for informational purposes only and is not financial or investment advice or a recommendation to buy or sell crypto assets.