
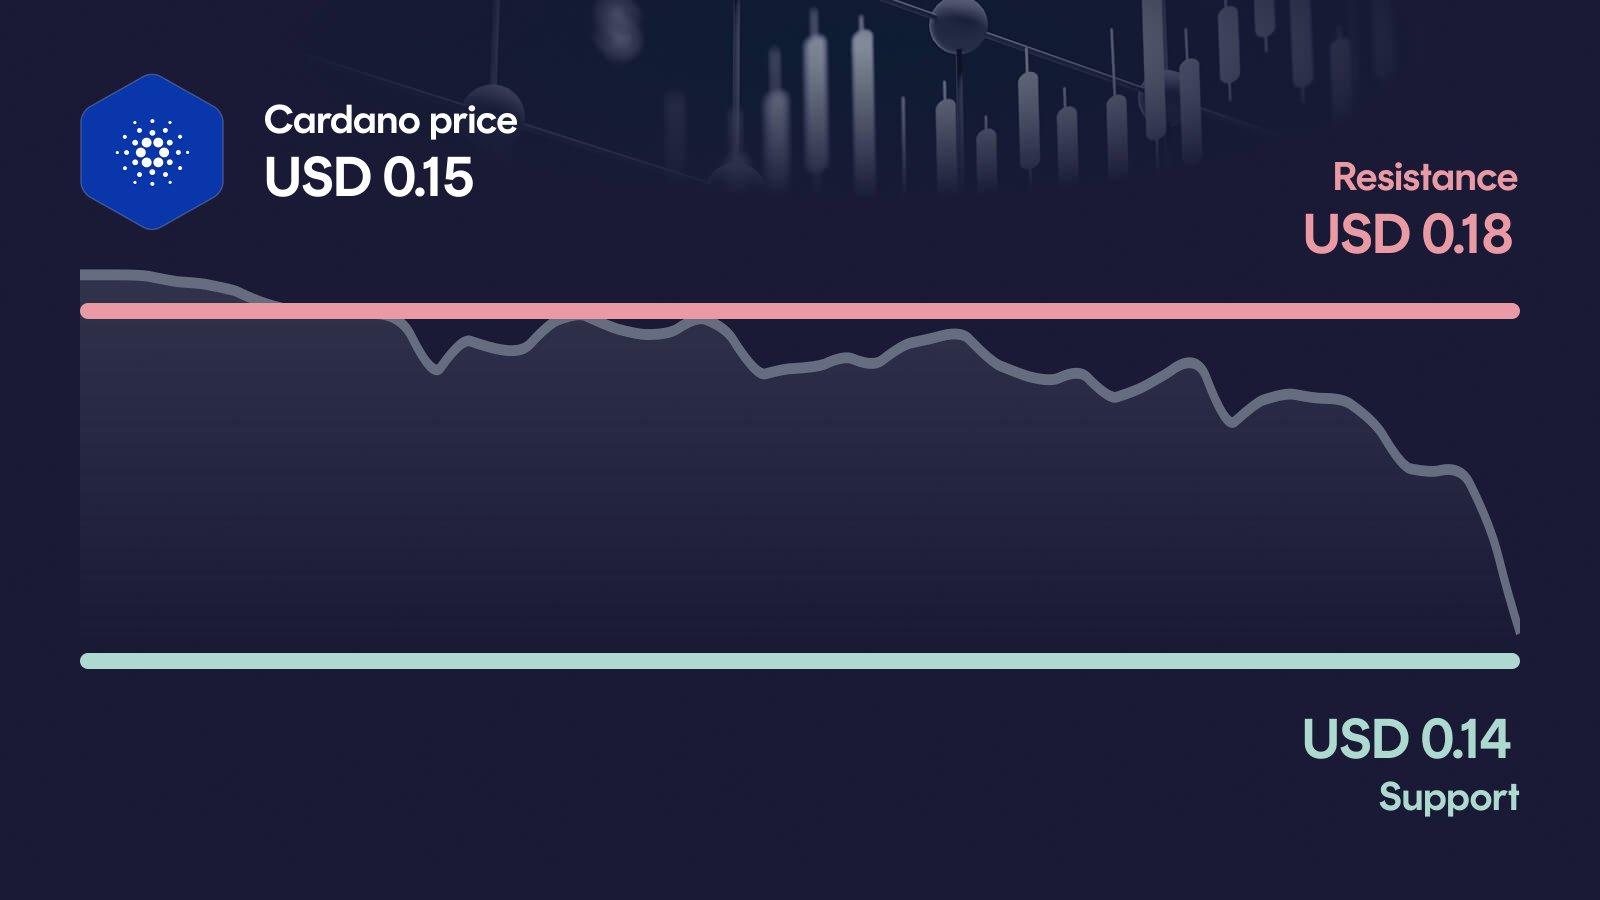
Cardano is under heavy pressure: ADA has lost more than 9% in 24 hours and is trading at $0.1502, just above the key support at $0.143. Volume is 87% above the 30-day average, RSI has dropped to 28, and MACD remains clearly bearish. The question now: can support hold, or is the next leg down already loading?
Key takeaways in a nutshell
Sharp sell-off: ADA trades at $0.1502 after a 9.2% daily drop and a 16.6% weekly loss, closing in on the monthly low at $0.144.
Trend clearly broken: Price sits 31% below the 50-day average ($0.218) and nearly 27% below the 200-day average ($0.205): a textbook downtrend.
$0.143 is the line: The $0.143 support is the last meaningful floor before the market has to look for new orientation lower.
RSI deeply oversold: At 28, the RSI signals oversold territory: short-term relief is possible, but it does not mark a trend reversal.
AI model sees long horizon: Our AI forecast for 2026 spans $0.74 to $1.65, with a midpoint around $1.22: well above current levels, but tied to a wide probability range.
What happened to the Cardano price?
Cardano has slipped to $0.1502, down more than 9% in 24 hours and over 16% on the week. That brings ADA within striking distance of the monthly low at $0.144 and extends a brutal 30-day drawdown of nearly 35%.
What stands out is the volume behind the move: trading activity has jumped to $451 million, around 87% above the 30-day average. Sellers are clearly in control, and the weekly high at $0.185 already feels distant. The 1-year performance of roughly -71% underlines just how damaged the broader trend structure has become.
Key price levels for Cardano
On the upside, the first meaningful resistance sits at $0.180, with a secondary hurdle at $0.192: only a reclaim of this zone would seriously question the bearish structure. On the downside, the critical support is $0.143, almost exactly matching the monthly low and acting as the last clear floor from recent trading. If that level breaks on a daily close, the next orientation lies lower around $0.167 as a reclaim target, but without that support, the market would be searching for a new base entirely.
Cardano indicators: RSI, MACD and volume
The three indicators currently paint a consistent, bearish picture, with one caveat. The RSI at 28 is firmly in oversold territory: this often precedes short-term bounces, but on its own it is not a reversal signal. The MACD remains bearish at -0.0126, and the histogram series shows no sign of a bullish crossover: downside momentum is still intact. Volume is 87% above the 30-day average, which confirms that the sell-off is being driven by real participation, not thin trading. Together, the setup reads as a strong downtrend with stretched conditions: a relief bounce is possible, but the trend signal remains clearly negative.
Relative Strength Index
MACD
AI forecast for Cardano
Looking toward year-end 2026, our AI forecast model places Cardano in a wide range between $0.74 and $1.65. The central expected value sits at around $1.22: not a price target, but the midpoint of a broad probability distribution.
The width of that range is the real message: it reflects how much uncertainty is currently priced into ADA after the recent slide. In the conservative case, the model still implies an upside of roughly +397% from today's $0.1502, while the optimistic case points to around +1,006%. Both numbers underline the long-term horizon of the model and should not be confused with a short-term directional call.
What could happen now?
Bullish scenario
A credible bullish case needs ADA to first stabilize above $0.143 and then reclaim the $0.180 resistance on strong volume. Such a move would break the current sequence of lower highs and open room toward the secondary resistance at $0.192. For the setup to carry weight, the RSI would need to work out of oversold territory without immediately overheating, while the MACD histogram turns higher and daily volume stays elevated. As long as the $0.143 zone is defended on any pullback, bulls at least keep a short-term recovery scenario alive.
Trigger: > $0.180 with elevated volume
Bearish scenario
The bearish case is already well supported: a daily close below $0.143 would confirm the loss of the last clear support and the monthly low at $0.144. In that case, the short-term setup would deteriorate further, with the RSI likely staying pinned in oversold territory and the MACD confirming continued downside pressure. The next orientation on the way up would then sit around $0.167, but without a defense of the current zone, there is no obvious technical anchor nearby on the downside. A sustained break would also cement the distance to the 50- and 200-day averages, keeping the medium-term trend firmly bearish.
Trigger: < $0.143
Conclusion: $0.143 level decides the direction
The technical setup is weak, but stretched enough that a short-term reaction cannot be ruled out. The decisive area is the $0.143 support zone, which now carries the full weight of the current structure.
If ADA defends this level and reclaims $0.180, the market could at least argue for a relief move within the broader downtrend. If $0.143 breaks on a daily close, the picture darkens quickly: there is no clear technical floor nearby, and sellers would likely stay in control. With volume running 87% above average and the RSI deeply oversold, every reaction at this level now carries extra weight. The next few trading days are likely to set the direction.
Want to buy Cardano? Kraken is our recommended crypto trading platform.
Continue to KrakenSince 2017, Philipp Duringer has been deeply involved in Bitcoin, crypto assets and digital financial markets. As the founder of Coinbird, he combines years of crypto experience with more than 15 years of technical experience in IT and digital products. His goal is to make crypto easier to understand, more transparent and easier to compare.
About the authorAI-assisted: This price analysis is generated automatically based on structured market data and reviewed through defined quality rules. It is for informational purposes only and is not financial or investment advice or a recommendation to buy or sell crypto assets.