
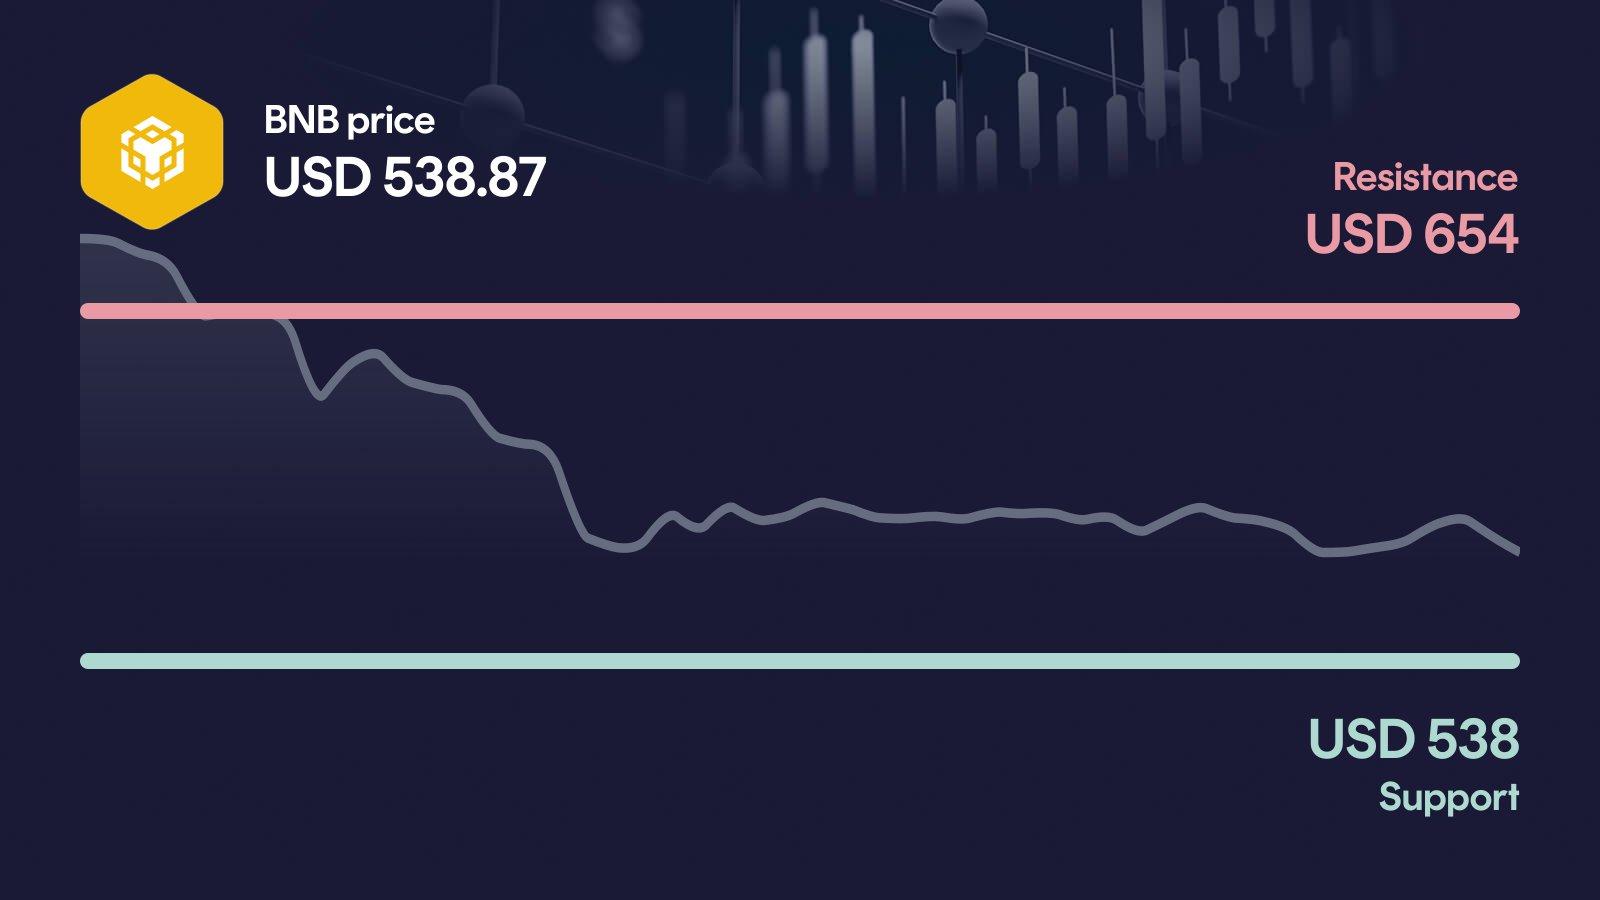
BNB is under heavy pressure, dropping 6.4% in a single day to $538.87 and testing its primary support zone head-on. RSI has crashed to 26, deep in oversold territory, while MACD confirms the bearish momentum. If support breaks here, the next relevant level sits far below at $495.
Key takeaways in a nutshell
Sharp daily drop: BNB fell 6.4% in 24 hours to $538.87, with a 30-day loss of over 28% weighing on sentiment.
Trend clearly broken: Price trades 24.5% below the 50-day average at $714 and 18.1% below the 200-day average at $658.
Support under siege: The $538 support is being tested right now, with $495 as the next relevant downside reference.
RSI deeply oversold: At an RSI of 26, BNB is technically oversold, which raises the odds of at least a short-term reaction.
AI sees upside room: The AI forecast model projects a 2026 range of $632 to $897, implying 18% to 67% upside from current levels.
What happened to the BNB price?
BNB dropped another 6.4% in the last 24 hours and is now trading at $538.87, right on top of its primary support zone. The slide extends a brutal stretch: BNB is down 14.6% over seven days and more than 28% over the past 30 days, with the monthly high at $761 feeling very far away.
What stands out is how orderly the selling looks. Volume at $1.03 billion is only 13.5% above the 30-day average, so this is not a classic capitulation flush. Instead, sellers are grinding the price into support with steady pressure, and that is exactly what makes the current level so critical.
Key price levels for BNB
The first relevant resistance sits at $654: a reclaim of this zone would be the first real sign that sellers are losing control, with $726 as the next hurdle above. Support at $538 matters because it currently lines up almost exactly with the spot price, meaning every further tick lower threatens a clean breakdown. If that level fails, the next logical reference is $495, where buyers would need to step in to prevent a deeper slide toward the monthly low at $566 being left firmly behind.
BNB indicators: RSI, MACD and volume
The three indicators currently paint a consistent picture, and it is not a friendly one. RSI at 26 is deep in oversold territory, which signals exhaustion on the downside but also often precedes at least a technical bounce. MACD at -36.3 confirms the bearish momentum, with the histogram deteriorating sharply over the last two weeks. Volume is only 13.5% above the 30-day average and classified as average, so there is no sign of panic selling or aggressive dip buying yet. Taken together, the setup is clearly bearish, but the extreme RSI reading suggests that the easy part of the move may already be behind us.
Relative Strength Index
MACD
AI forecast for BNB
Looking toward year-end 2026, our AI forecast model places BNB in a range between $632.70 and $897.85. The central expected value sits at around $772.78, which is not a price target, but the midpoint of a broad probability distribution derived from historical patterns and current market conditions.
The width of that range is the real message here: it signals meaningful uncertainty, which fits the current technical picture of a coin fighting for its primary support. In the conservative case, that still translates to roughly 18.1% upside from the current $538.87, while the optimistic end of the range implies around 67.6% upside. For a token this deeply oversold, that spread shows why the next few weeks of price action matter so much for the medium-term trajectory.
What could happen now?
Bullish scenario
The bullish case requires BNB to first stabilize above $538 and then reclaim the $654 resistance on clearly rising volume. Such a move would flip the short-term structure, with the deeply oversold RSI providing fuel for a sharper mean-reversion bounce. For this to hold, MACD would need to roll higher out of its current lows and volume would have to confirm the move rather than fade. As long as BNB defends the $538 zone on any pullback, the path toward $726 as the next meaningful resistance stays open.
Trigger: > $654 with elevated volume
Bearish scenario
The bearish case triggers the moment BNB loses the $538 support on a sustained basis. That would confirm the ongoing downtrend, with MACD already deeply negative and the histogram still pointing lower, leaving little technical backing for a quick recovery. The next relevant reference level sits at $495, where buyers would get a second chance to defend the trend. A clean break below that zone would put further pressure on the medium-term structure, with price already trading 18% under the 200-day average at $658.
Trigger: < $538
Conclusion: $538 level decides the direction
The technical setup is fragile, but the extreme RSI reading of 26 keeps the door open for a sharp counter-move. The decisive area is the $538 support zone, which is being tested right now.
A reclaim of $654 would be the first real signal that sellers are losing their grip and could open the way toward $726. A clean break below $538, on the other hand, would expose $495 and reinforce a downtrend that already shows BNB trading more than 24% under its 50-day average. With momentum deeply stretched and price glued to support, the next few trading days are likely to set the direction.
Want to buy BNB? Kraken is our recommended crypto trading platform.
Continue to KrakenSince 2017, Philipp Duringer has been deeply involved in Bitcoin, crypto assets and digital financial markets. As the founder of Coinbird, he combines years of crypto experience with more than 15 years of technical experience in IT and digital products. His goal is to make crypto easier to understand, more transparent and easier to compare.
About the authorAI-assisted: This price analysis is generated automatically based on structured market data and reviewed through defined quality rules. It is for informational purposes only and is not financial or investment advice or a recommendation to buy or sell crypto assets.