
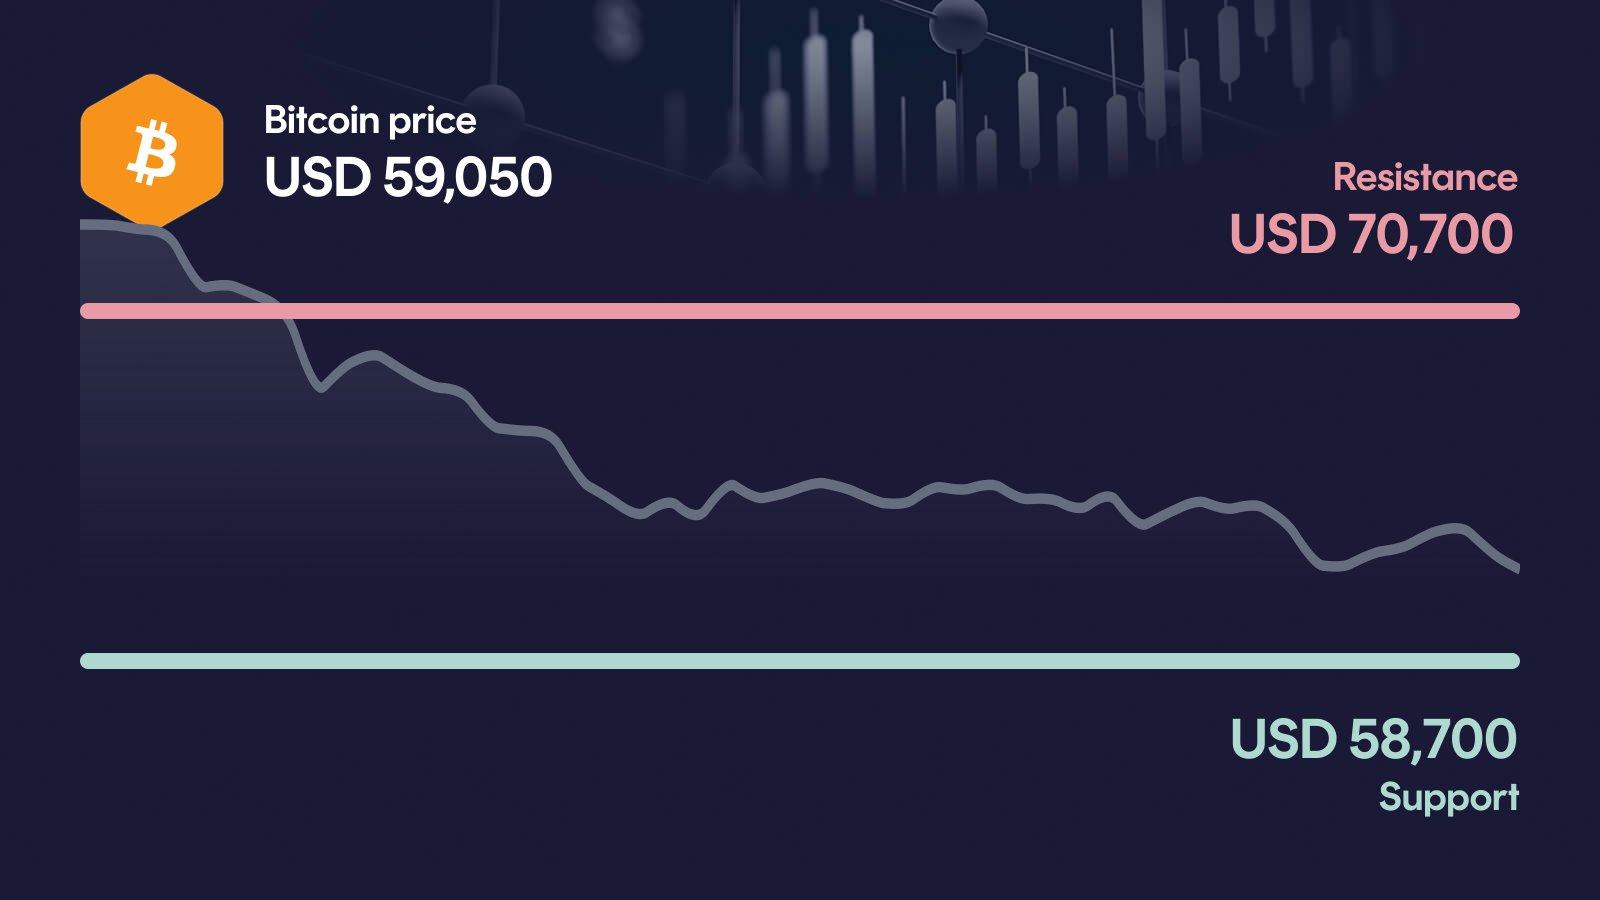
Bitcoin is under heavy pressure: BTC has lost nearly 6% in a day and over 14% in a week, slipping to $59,050 and pushing right into the primary support at $58,700. The RSI has crashed to 22, deeply oversold, while MACD remains firmly bearish and the price trades far below both the 50- and 200-day averages. Now it gets serious: if $58,700 breaks, the next reference zone sits noticeably lower.
Key takeaways in a nutshell
Sharp daily drop: Bitcoin trades at $59,050 after a 5.9% daily loss and a 14% weekly decline, with volume running 61% above the 30-day average.
Trend clearly broken: BTC sits roughly 25% below the 50-day average at $78,600 and nearly 19% below the 200-day average at $72,700, confirming a weak trend structure.
Decision at $58,700: The primary support at $58,700 is being tested directly; below it, $54,300 becomes the next line of defense.
RSI at extreme: The RSI has collapsed to 22, deep in oversold territory, which raises the chance of a technical bounce but does not neutralize the downtrend.
AI sees wide range: The AI forecast model projects a year-end 2026 range between $66,171 and $98,716, with a midpoint near $80,822.
What happened to the Bitcoin price?
Bitcoin has dropped to $59,050, extending a sharp sell-off that has shaved 5.9% off the price in 24 hours and 14% over the past week. The move pushes BTC directly into its primary support zone around $58,700 and leaves the chart clearly below the weekly high of $74,100.
The 30-day picture looks even heavier: Bitcoin is down more than 30% from the monthly high of $84,800. What stands out is the volume: 24-hour turnover of roughly $48.1 billion runs about 61% above the 30-day average, a sign that this move is being carried by real activity, not a thin market.
Key price levels for Bitcoin
The first meaningful resistance sits at $70,700; only a reclaim of this zone would meaningfully improve the short-term picture and open the path back toward $78,500. On the downside, the key level is $58,700, which is being actively tested right now and marks the line that separates a controlled pullback from a deeper breakdown. If that support fails on a daily basis, the next relevant reference is the secondary support at $54,300.
Bitcoin indicators: RSI, MACD and volume
The three indicators currently paint a consistent, clearly bearish picture, with only one nuance. The RSI has crashed to 22, which is deeply oversold and historically increases the probability of a short-term technical bounce, without changing the broader trend. The MACD remains firmly bearish at roughly -4,199, and the histogram has deepened markedly over the last sessions, confirming that downside momentum is still intensifying. Volume at 61% above the 30-day average underscores that the sell-off is being driven by conviction rather than illiquidity. Taken together, the setup reads as a strong downtrend meeting an oversold extreme: pressure dominates, but the elastic is stretched.
Relative Strength Index
MACD
AI forecast for Bitcoin
Looking toward year-end 2026, our AI forecast model places Bitcoin in a wide range between $66,171 and $98,716. The central expected value comes in around $80,822, which is not a price target, but the midpoint of a broad probability distribution derived from historical patterns and current market conditions.
The width of this range reflects how uncertain the setup is after the recent decline: even the conservative end of the model sits noticeably above today's price. In concrete terms, the conservative case corresponds to a gain of about 11.9% from current levels, while the optimistic case implies roughly 66.9% upside. That spread shows how much depends on whether the current support zone can stabilize.
What could happen now?
Bullish scenario
A bullish setup would require Bitcoin to first defend $58,700 and then reclaim the $70,700 resistance on sustained, above-average volume. In that case, the extreme RSI reading of 22 could fuel a sharp mean-reversion move back toward the 50-day average near $78,600. For the move to carry weight, the MACD histogram would need to flatten and turn upward, and volume should keep confirming buyer interest. As long as $58,700 holds as a floor, the short-term setup stays salvageable.
Trigger: > $70,700 with elevated volume
Bearish scenario
The bearish scenario triggers if Bitcoin loses $58,700 on a daily basis and fails to reclaim it quickly. In that case, the next relevant reference level sits at the secondary support of $54,300, which would become the next decisive battleground. A break there would deepen the already weak picture, with BTC trading roughly 25% below the 50-day average and 19% below the 200-day average. The combination of a bearish MACD and strong sell volume would then put additional pressure on the medium-term trend.
Trigger: < $58,700
Conclusion: $58,700 level decides the direction
The technical setup is fragile, but the extreme RSI reading of 22 shows how far the move has already stretched to the downside. The decisive area is the support zone around $58,700, where the short-term direction will be decided.
If buyers defend this level and push Bitcoin back above $70,700, an oversold-driven rebound becomes plausible. If $58,700 breaks instead, $54,300 moves into focus as the next relevant stop, and the broader downtrend gains further confirmation. The next few trading days are likely to set the direction.
Want to buy Bitcoin? Kraken is our recommended crypto trading platform.
Continue to KrakenSince 2017, Philipp Duringer has been deeply involved in Bitcoin, crypto assets and digital financial markets. As the founder of Coinbird, he combines years of crypto experience with more than 15 years of technical experience in IT and digital products. His goal is to make crypto easier to understand, more transparent and easier to compare.
About the authorAI-assisted: This price analysis is generated automatically based on structured market data and reviewed through defined quality rules. It is for informational purposes only and is not financial or investment advice or a recommendation to buy or sell crypto assets.