This Zcash price analysis was published on and is not the latest edition.
Zcash is under heavy pressure after losing roughly a quarter of its value in a week and pulling back toward the key support area near $265. The MACD remains clearly bearish, volume is well below the 30-day average, and buyers have shown little conviction so far. If this support fails, the correction could quickly extend toward lower reference zones.
Key takeaways in a nutshell
Sharp weekly drop: Zcash trades near $433 after losing about 24% over the past seven days.
Trend cracks open: The price sits roughly 13% below the 50-day average at $496, while the 200-day at $377 still holds as a wider safety net.
Support in focus: The decisive zone is now $265: a break would open the door to deeper levels.
Momentum stays weak: RSI at 43 and a clearly negative MACD confirm that sellers remain in control.
AI sees upside range: For year-end 2026, the model places ZEC between $493 and $898, well above current levels.
What happened to the Zcash price?
Zcash is trading around $433, after a 24-hour gain of about 1.5% that does little to soften a brutal week. Over the past seven days, ZEC has lost roughly 24%, and the 30-day picture looks almost identical with a drop of about 23%. The weekly high near $638 now feels far away, and the price has retreated sharply from the monthly peak around $686.
The most notable signal is volume: 24-hour turnover sits near $636 million, almost 29% below the 30-day average. That means the slide is not being driven by panic selling, but rather by missing buyers. In a market that just corrected this hard, fading volume is a warning sign, not a relief.
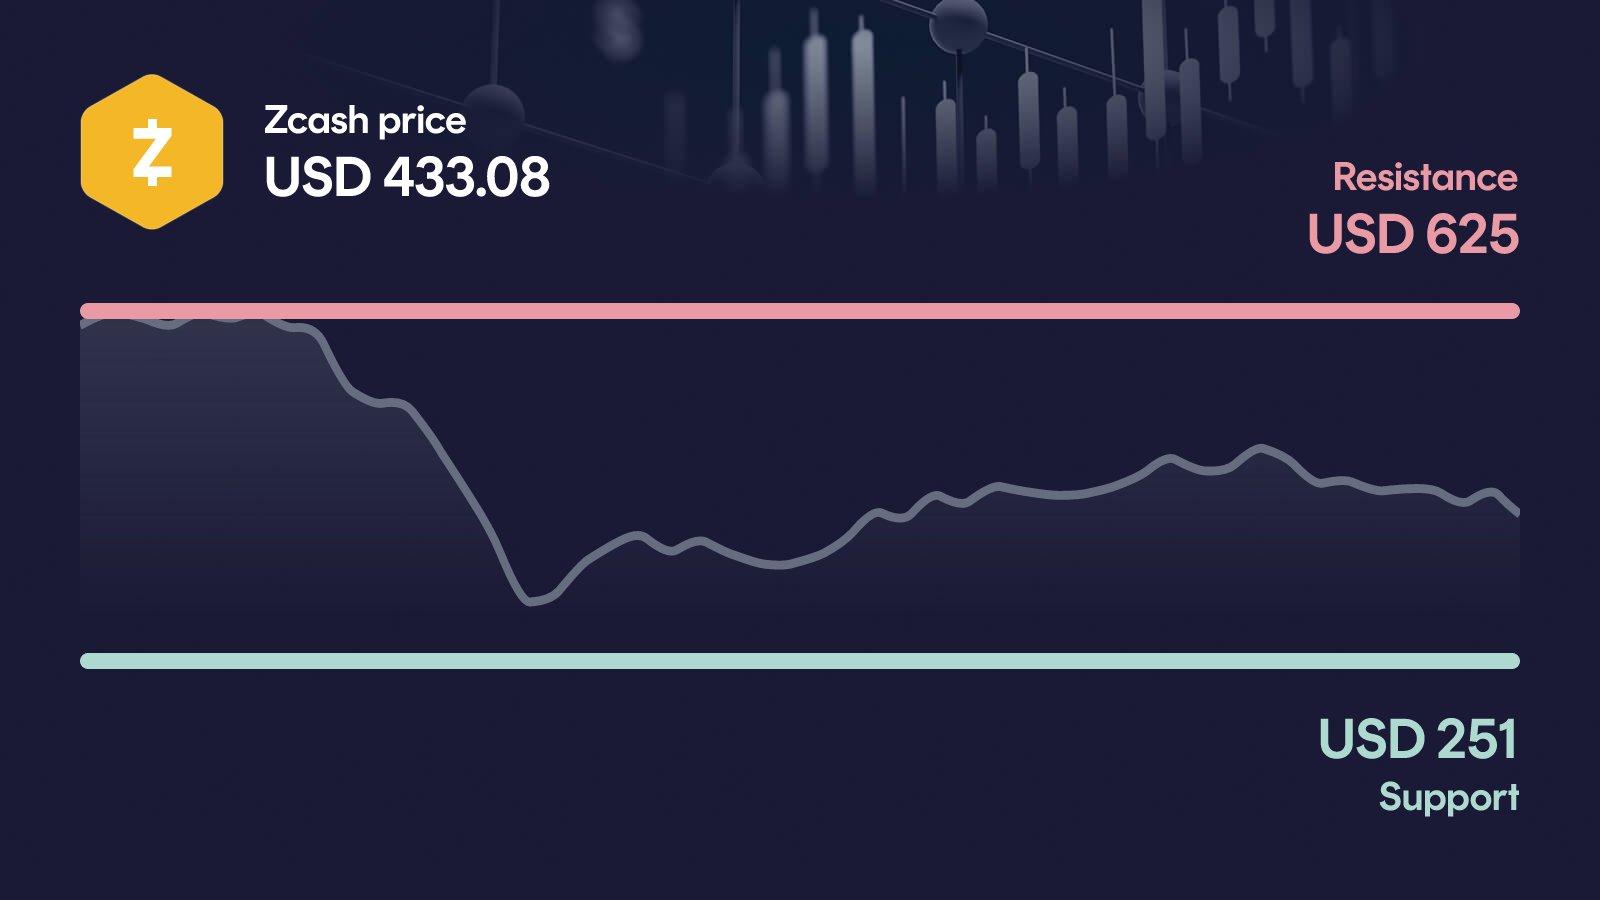
Key price levels for Zcash
These are the key zones now: The resistance at $625 is the next major hurdle, and only a move back above it would seriously challenge the current bearish structure. On the downside, the area around $265 acts as primary support, lining up closely with the recent monthly low and marking the line that bulls cannot afford to lose. If Zcash slips below it, the next relevant orientation point sits much lower, with secondary support not appearing until the $71 region.
Zcash indicators: RSI, MACD and volume
The three indicators currently paint a consistent, bearish-leaning picture. The RSI at 43 sits in neutral territory but is clearly tilted toward the weaker side, with no sign of an oversold bounce setup yet. The MACD is firmly negative at around -25 with a bearish signal, and the histogram series shows momentum that has deepened rather than recovered in recent readings. Volume is about 29% below the 30-day average, which means the decline is happening on thinning participation rather than fresh demand. Taken together, the indicators suggest that the path of least resistance still points lower until either momentum turns or buyers actually show up.
Relative Strength Index
MACD
AI forecast for Zcash
Looking toward year-end 2026, our AI forecast model places Zcash in a wide range between $493 and $898. The central expected value sits around $665, but this is not a price target: it is the midpoint of a broad probability distribution, with significant uncertainty in both directions.
The range matters more than the midpoint because it shows how asymmetric the setup looks from current levels. In the conservative case, ZEC would still trade roughly 15% above today's price, while the optimistic case implies an upside of around 110%. That mismatch between weak short-term technicals and a constructive longer-term model output is exactly why the $265 support is so important: it decides whether this correction stays a setback or turns into a deeper trend break.
What could happen now?
Bullish scenario
A real bullish case requires Zcash to reclaim the $625 resistance on clearly stronger volume, ideally accompanied by a MACD turn back above zero. In that scenario, the recent sell-off would start to look like a shakeout rather than the beginning of a deeper downtrend. The RSI would have room to expand without immediately overheating, and the 50-day average near $496 could flip from resistance into support. To keep this setup intact, the price should not lose the $265 zone again on any pullback. As long as that line holds, the bulls retain a credible path back into the broader uptrend.
Trigger: > $625 with elevated volume
Bearish scenario
The bearish case becomes serious if Zcash loses the $265 support on a daily basis. Below that level, the short-term structure would clearly break, with MACD already bearish and volume offering no defense. The next meaningful orientation point sits far lower, with secondary support not appearing until around $71, which underlines how thin the safety net becomes once $265 gives way. A sustained move under that zone would also pull the price toward the 200-day average at $377 from above, putting the medium-term trend under real pressure. In that case, the market would need to show whether demand returns at lower levels or whether sellers stay in control.
Trigger: < $265
Conclusion: $265 support decides the direction
The technical setup for Zcash is currently fragile, but not yet broken. The decisive area is the $265 support zone, which sits right at the recent monthly low and acts as the last clear line between a sharp correction and a deeper structural breakdown.
If this support holds and Zcash can fight its way back above the 50-day average toward $625, the recent sell-off could turn out to be an aggressive shakeout inside a larger uptrend. If $265 breaks, the picture changes quickly, with the next meaningful orientation point far below and the medium-term trend coming under serious pressure. The next few trading days are likely to set the direction.
Want to buy Zcash? Kraken is our recommended crypto trading platform.
Continue to KrakenSince 2017, Philipp Duringer has been deeply involved in Bitcoin, crypto assets and digital financial markets. As the founder of Coinbird, he combines years of crypto experience with more than 15 years of technical experience in IT and digital products. His goal is to make crypto easier to understand, more transparent and easier to compare.
About the authorAI-assisted: This price analysis is generated automatically based on structured market data and reviewed through defined quality rules. It is for informational purposes only and is not financial or investment advice or a recommendation to buy or sell crypto assets.