
This Ethereum price analysis was published on and is not the latest edition.
Ethereum is under heavy pressure and approaching the critical support zone near $1,470. The MACD remains deeply bearish, the RSI has slipped into oversold territory, and volume offers no signs of strong buying interest. If support breaks, the correction could quickly accelerate toward the next downside reference.
Key takeaways in a nutshell
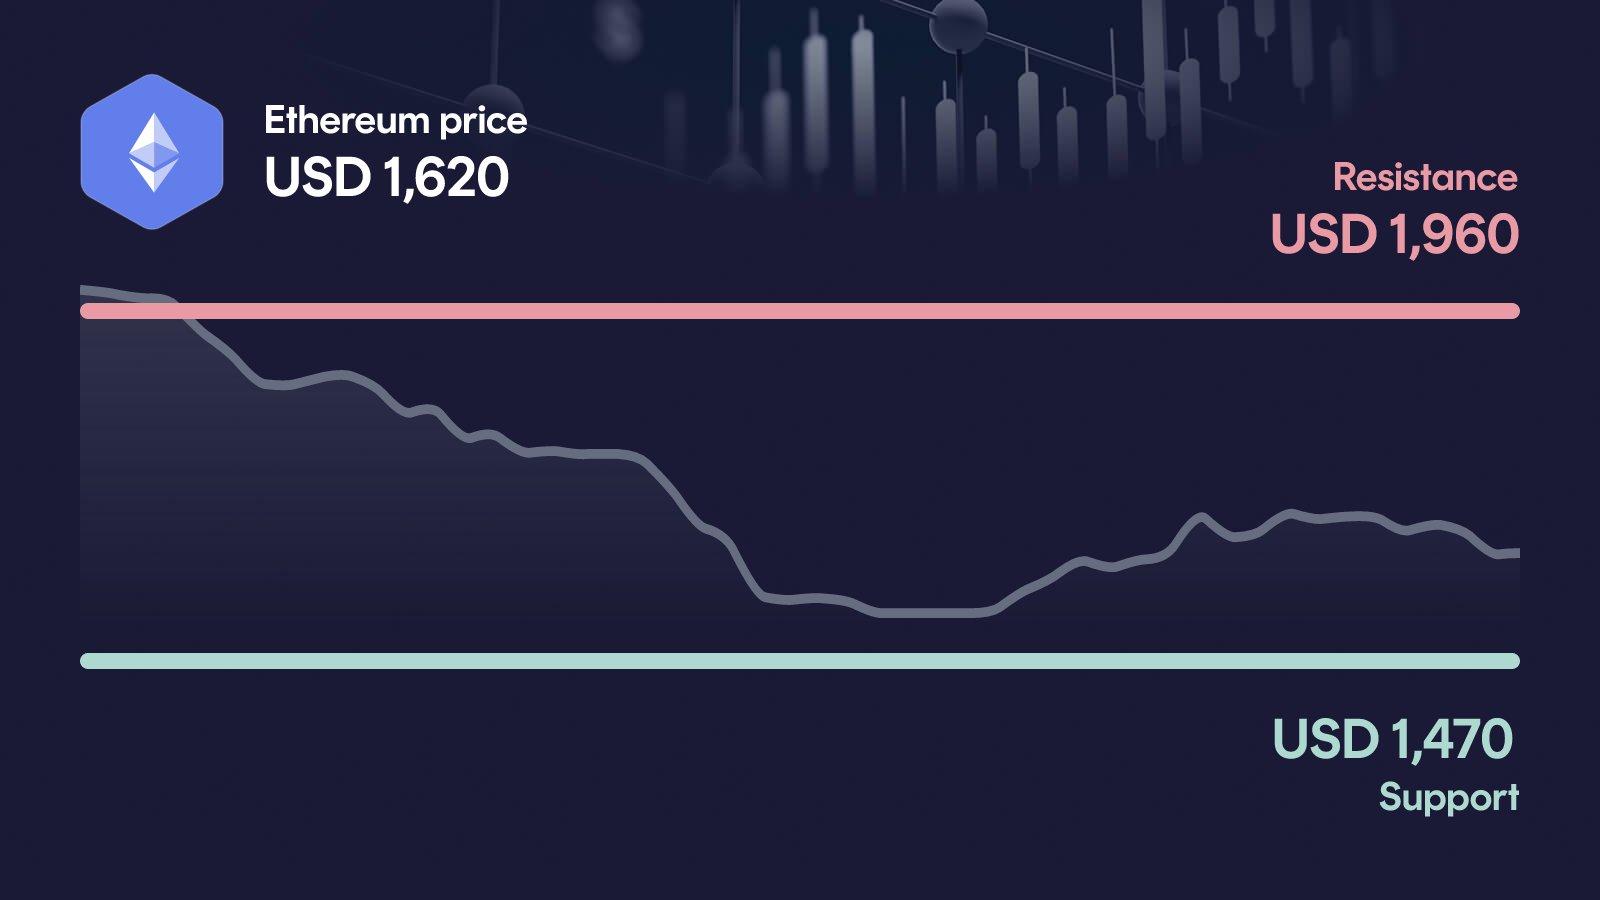
Sell-off accelerates: Ethereum trades near $1,620 after losing more than 13% in seven days and over 30% in a month.
Trend deeply broken: The price sits roughly 25% below the 50-day average and 34% below the 200-day average.
Support in focus: The zone around $1,470 is the last meaningful line before the move opens up further.
Momentum exhausted: With RSI at 28 and MACD at -143, the technical picture is clearly bearish.
Forecast stays wide: The AI model sees a 2026 range from roughly $2,063 to $3,401, well above current levels.
What happened to the Ethereum price?
Ethereum is trading at around $1,620, after losing roughly 13.6% in the past week and a sharp 30.6% over the last 30 days. The weekly high near $2,000 already feels far away, while the move toward $1,510 shows how quickly the selling pressure has intensified.
The most notable signal is volume: at $13.2 billion, 24-hour turnover sits about 15% below the 30-day average. That means the slide is not being driven by panic selling, but by a steady lack of demand. Buyers are simply not stepping in, and that is often the more dangerous setup.
Key price levels for Ethereum
These are the key zones now: The resistance at $1,960 is the next major hurdle, and only a clear move above it would signal that buyers are regaining control. On the downside, the area around $1,470 acts as support, and it is the last technical line keeping the broader structure intact. If Ethereum falls below it, the next relevant level near $1,240 quickly comes into focus as the dominant downside reference.
Ethereum indicators: RSI, MACD and volume
The three indicators currently paint a consistent and clearly bearish picture. The RSI at 28 has dropped into oversold territory, which signals exhaustion but in a strong downtrend is rarely a reliable buy signal on its own. The MACD at -143 remains deeply bearish, and the recent histogram readings show that downside momentum has accelerated rather than faded. Volume sits about 15% below the 30-day average, meaning there is no visible accumulation that would support a sustainable reversal. Taken together, the indicators describe a market that is weak, drained of momentum and lacking the buying pressure needed for a fast recovery.
Relative Strength Index
MACD
AI forecast for Ethereum
Looking toward year-end 2026, our AI forecast model places Ethereum in a wide corridor between roughly $2,063 and $3,401. The central expected value sits near $2,785, but this number is not a price target: it is the midpoint of a broad probability distribution that reflects how uncertain the medium-term setup currently is.
The range itself is more informative than the midpoint. In the conservative case, ETH would still need to rise by about 26.5% from current levels, while the optimistic case implies an upside of roughly 108.6%. That gap shows how much the short-term technical weakness contrasts with the longer-term model expectation, and why the reaction at the $1,470 support is so important for the path ahead.
What could happen now?
Bullish scenario
For a credible turnaround, Ethereum would first need to reclaim the area around $1,960 with clearly rising volume. In that case, the deeply oversold RSI could turn into a tailwind, and the MACD would have room to ease back toward neutral territory. To keep the setup intact, the price should not fall back below the recovered zone, and buyers would need to defend the $1,620 region on any pullback. Only then would the current weakness look like a washout rather than the start of a new leg lower.
Trigger: > $1,960 with elevated volume
Bearish scenario
The decisive line is the support at $1,470. If Ethereum loses this zone on a daily close, the technical picture would worsen significantly, since RSI and MACD already signal pronounced weakness. The next relevant reference would then be the area around $1,240, which represents the secondary support in the current structure. A move into that zone would put additional pressure on the medium-term trend and force the market to prove that demand still exists at lower levels.
Trigger: < $1,470
Conclusion: $1,470 level decides the direction
The technical setup is clearly fragile, but the deeply oversold RSI leaves room for at least a short-term reaction. The decisive area is the support zone around $1,470, which now carries the entire short-term structure.
If this level holds and Ethereum manages to reclaim ground toward $1,960, the current sell-off could be reinterpreted as a capitulation low. If support breaks, however, the path toward $1,240 opens up quickly and the broader trend would weaken further. With momentum stretched and volume uninspired, the market is at a sensitive point. The next few trading days are likely to set the direction.
Want to buy Ethereum? Kraken is our recommended crypto trading platform.
Continue to KrakenSince 2017, Philipp Duringer has been deeply involved in Bitcoin, crypto assets and digital financial markets. As the founder of Coinbird, he combines years of crypto experience with more than 15 years of technical experience in IT and digital products. His goal is to make crypto easier to understand, more transparent and easier to compare.
About the authorAI-assisted: This price analysis is generated automatically based on structured market data and reviewed through defined quality rules. It is for informational purposes only and is not financial or investment advice or a recommendation to buy or sell crypto assets.