This Cardano price analysis was published on and is not the latest edition.
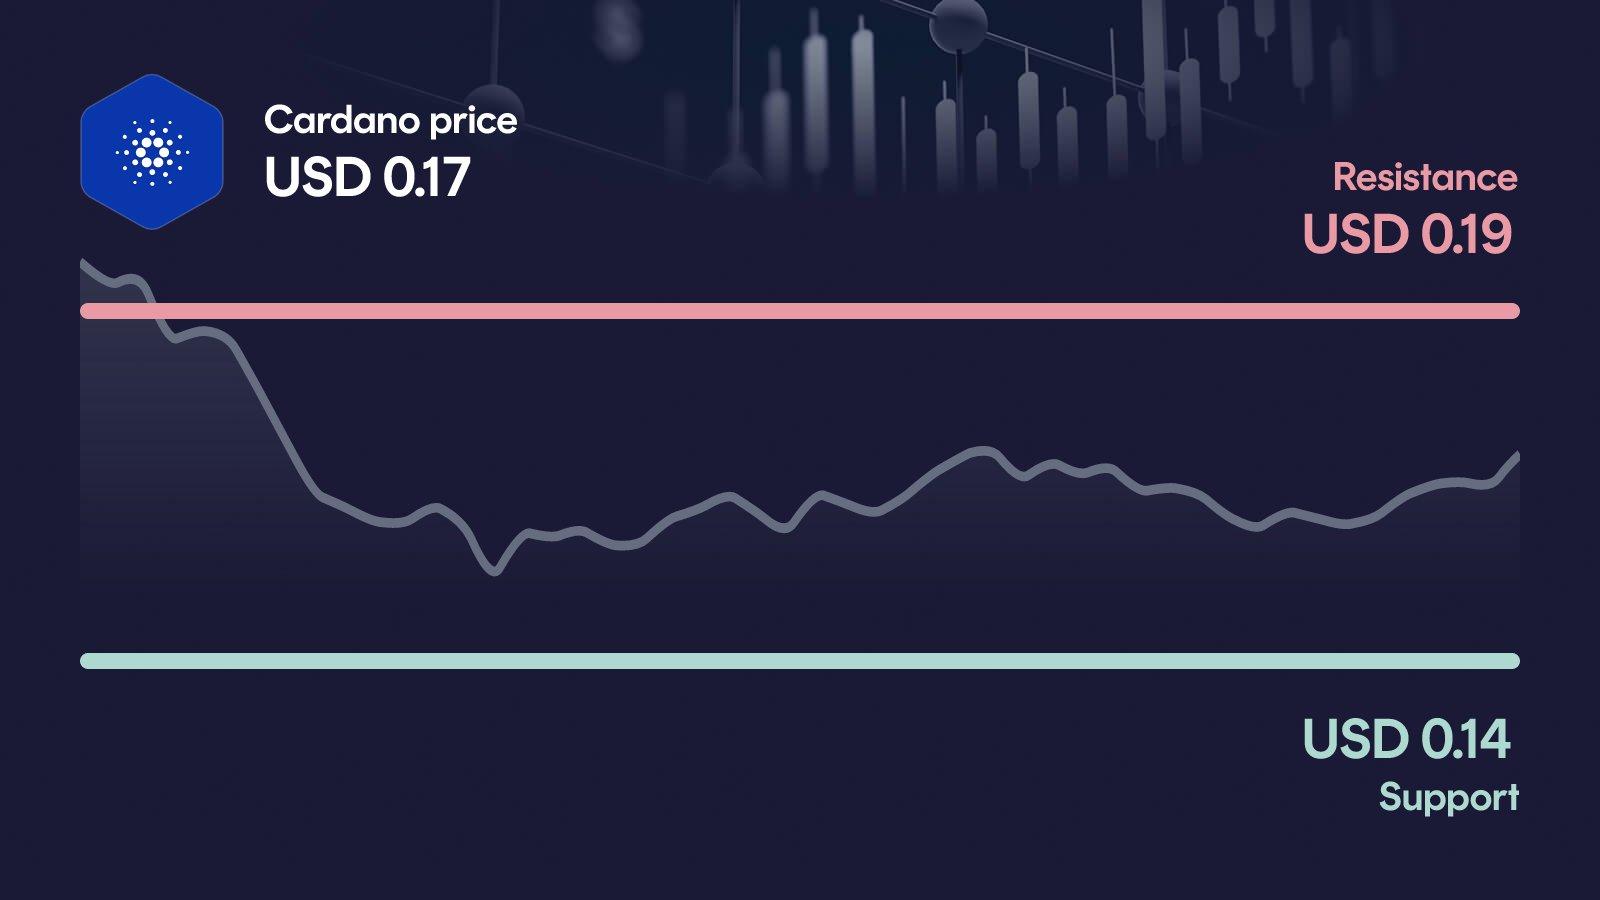
Cardano is trading near $0.17 after a brutal 30-day drop of nearly 38%, with the price sitting far below the 50- and 200-day moving averages. The RSI has crashed to 22, deep into oversold territory, while the MACD remains bearish. Now the support zone around $0.14 becomes the decisive line: if it breaks, the next leg lower could open up quickly.
Key takeaways in a nutshell
Pressure remains high: ADA trades near $0.1701 after losing roughly 38% in 30 days, with only a fragile 3.5% bounce over the past week.
Trend clearly broken: The price sits about 28% below the 50-day average ($0.238) and 43% below the 200-day average ($0.301).
Support must hold: The $0.14 zone is now the decisive line. A break opens the path toward the $0.119 area.
Deeply oversold: RSI at 22 signals exhaustion, but the bearish MACD shows momentum has not yet turned.
AI sees recovery room: The forecast model points to a 2026 range of $0.22 to $0.59, with the midpoint near $0.324.
What happened to the Cardano price?
Cardano is trading at $0.1701, up around 1.9% on the day and 3.5% over the past week. Zoomed out, the picture is far less friendly: ADA has lost about 37.6% in 30 days and roughly 75% over the past year. The weekly high at $0.201 was rejected, and the price has since drifted back toward the lower end of its recent range.
The most notable signal is volume: at $460 million in 24 hours, it sits essentially in line with the 30-day average (-1.1%). In other words, this slide is not being driven by a panic spike, but by a steady, grinding outflow, exactly the kind of backdrop that makes the next test of support so important.
Key price levels for Cardano
These are the key zones now: The resistance at $0.192 is the next major hurdle, and a move above it would be the first real sign that buyers are regaining control. On the downside, the area around $0.14 acts as primary support, and it is the line that has so far prevented a deeper breakdown. If Cardano falls below it, the next relevant reference point sits near $0.119, which would mark a clear extension of the current downtrend.
Cardano indicators: RSI, MACD and volume
The three indicators currently paint a consistent picture, and it is not a constructive one. The RSI at 22 is deep in oversold territory, which signals exhaustion but is not yet a turnaround signal on its own. The MACD remains bearish at -0.024, confirming that momentum still points downward despite the recent stabilization attempt. Volume at -1.1% versus the 30-day average is essentially neutral, meaning there is no sign of fresh accumulation stepping in. Taken together, the setup suggests a market that is stretched to the downside but lacks the buying pressure needed to turn the trend.
Relative Strength Index
MACD
AI forecast for Cardano
Looking toward year-end 2026, our AI forecast model places Cardano in a wide range from $0.217 to $0.590. The central expected value sits near $0.324, but this figure should not be read as a price target, rather as the midpoint of a broad probability distribution.
The width of that range matters more than the midpoint itself, because it reflects how uncertain the path out of the current downtrend actually is. In the conservative case, ADA would still gain about 28% from today's level, while the optimistic case implies an upside of roughly 248%. The spread underlines that the model sees recovery potential, but only if the technical picture begins to stabilize first.
What could happen now?
Bullish scenario
A reclaim of the $0.192 resistance on rising volume would be the first real sign that buyers are stepping back in. In that case, the deeply oversold RSI could turn from a warning into a fuel source for a counter-move toward the next orientation zone near $0.222. For this to hold, the MACD would need to start curling upward and volume should expand, not fade. Crucially, ADA would have to defend the $0.14 zone in any pullback. Then the bounce would no longer look like a short-term reflex, but like the beginning of a genuine stabilization.
Trigger: > $0.192 with elevated volume
Bearish scenario
If Cardano loses the $0.14 support, the current weakness would gain a new dimension. The next reference level sits around $0.119, and a move into that zone would extend the downtrend that has already wiped out nearly 38% in 30 days. The bearish MACD and the lack of volume-driven buying would back such a move, while the oversold RSI alone has not been enough to stop the slide. A sustained break below $0.119 would then put additional pressure on the medium-term trend, which already sits more than 43% below the 200-day average.
Trigger: < $0.14
Conclusion: $0.14 support decides the direction
The technical setup is fragile, but the deeply oversold RSI shows how stretched the move has become. The decisive area is the $0.14 support zone, which now separates a possible stabilization from the next leg lower.
A reclaim of $0.192 would be the first signal that buyers are regaining control and could open the door toward $0.222. A break of $0.14, on the other hand, would expose the $0.119 area and confirm that the downtrend still has room to run. Until one of these levels gives way, the market remains caught between exhaustion and ongoing pressure. The next few trading days are likely to set the direction.
Want to buy Cardano? Kraken is our recommended crypto trading platform.
Continue to KrakenSince 2017, Philipp Duringer has been deeply involved in Bitcoin, crypto assets and digital financial markets. As the founder of Coinbird, he combines years of crypto experience with more than 15 years of technical experience in IT and digital products. His goal is to make crypto easier to understand, more transparent and easier to compare.
About the authorAI-assisted: This price analysis is generated automatically based on structured market data and reviewed through defined quality rules. It is for informational purposes only and is not financial or investment advice or a recommendation to buy or sell crypto assets.