
Cosmos is pushing back toward the $2 mark after a strong 22% weekly rally, with resistance at $2.17 now firmly in focus. The trend picture is improving, but the MACD remains bearish and volume has cooled. If buyers manage to clear the next hurdle, the setup could shift decisively. If not, the rally risks turning into a fake-out.
Key takeaways in a nutshell
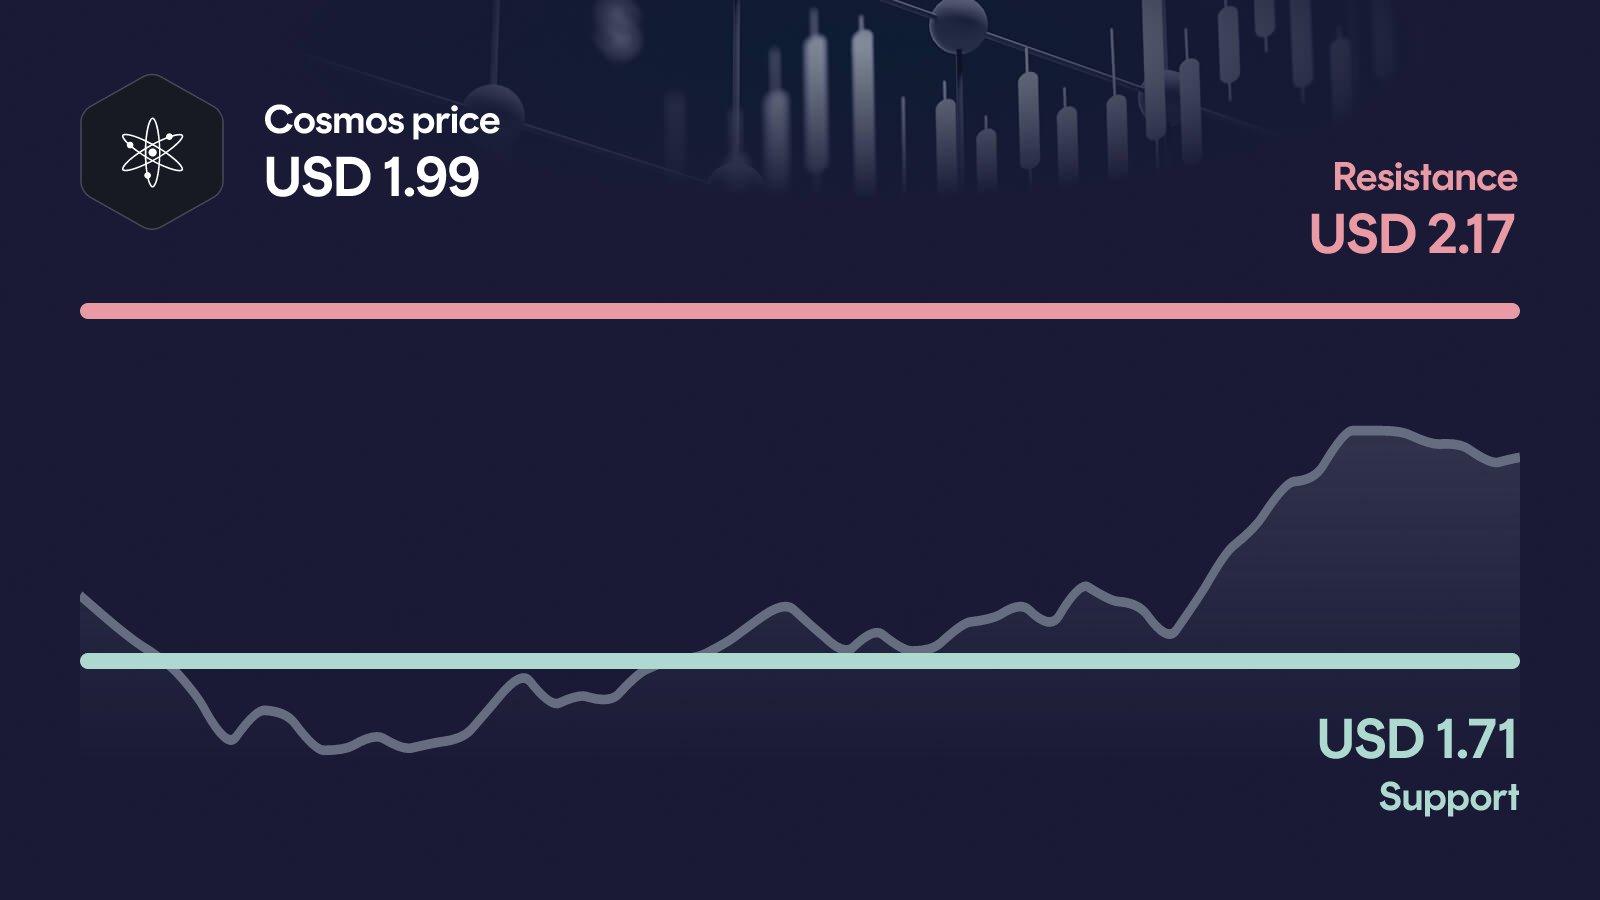
Rally regains traction: ATOM trades near $1.99 after climbing 22% in the past seven days.
Trend turning constructive: Price sits 2% above the 50-day average but still 2% below the 200-day line at $2.03.
Breakout in focus: Above $2.17, the technical setup would clearly improve.
Momentum still mixed: RSI at 57 leans bullish, but MACD has not yet flipped positive.
AI sees upside room: The model projects a 2026 range between $2.45 and $4.04.
What happened to the Cosmos price?
Cosmos is currently trading at around $1.99, just below the weekly high of $2.03. Over the past seven days, ATOM has gained an impressive 22.4%, while the 30-day balance remains slightly negative at -1.4%. The recovery clearly stands out against the longer-term weakness, with the coin still down more than 51% year-on-year.
The most notable signal is volume: 24-hour turnover sits at about $35.9 million, around 17% below the 30-day average. That means the recent surge has not yet been backed by a clear acceleration in participation, which raises the question of whether the move has enough fuel to break out.
Key price levels for Cosmos
These are the key zones now: The resistance at $2.17 is the next major hurdle, and a move above it would confirm the breakout and open the path toward $2.33. On the downside, the area around $1.71 acts as support, since it aligns with the recent base of the rally. If Cosmos falls below it, the next relevant level near $1.57 becomes the key reference point.
Cosmos indicators: RSI, MACD and volume
The three indicators currently paint a mixed picture. The RSI at 57 sits in moderately bullish territory, signaling momentum without overheating. The MACD remains bearish at -0.052, although the histogram has been narrowing for several sessions, which weakens the negative signal. Volume is roughly 17% below the 30-day average, suggesting that the rally has not yet attracted broad conviction. Together, this points to a constructive but not yet confirmed setup that still needs a real impulse to validate the move.
Relative Strength Index
MACD
AI forecast for Cosmos
Looking toward year-end 2026, our AI forecast model places Cosmos in a wide range between $2.45 and $4.04. The central expected value sits at around $3.15, but this is not a price target, it is the midpoint of a broad probability distribution. The width of the range matters more than the midpoint, because it shows that the model sees clear upside potential without ruling out continued volatility.
In the conservative case, ATOM would gain about 23.6% versus the current price, while the optimistic case implies roughly 103.7% upside. That spread underlines that the longer-term picture remains constructive, but heavily dependent on whether the current resistance zone is reclaimed in the coming weeks.
What could happen now?
Bullish scenario
If Cosmos clears the resistance at $2.17 on rising volume, the breakout would no longer look like a short-term impulse, but would be much better supported. The next reference level above would be $2.33, and a sustained move there would also push the price firmly above the 200-day average at $2.03. For the setup to remain healthy, the RSI should not overheat and the MACD would need to flip positive to confirm the shift. Just as importantly, the $1.71 support should not be lost again in any pullback.
Trigger: > $2.17 with elevated volume
Bearish scenario
If ATOM fails at the $2.17 resistance and slides back below $1.71, the recent rally would quickly lose its structural foundation. The next reference point on the downside would be $1.57, which also marks the 30-day low. A break of that area would clearly weaken the medium-term trend and bring the secondary support near $1.41 into focus. In that case, the market would need to show whether demand returns at lower levels or whether the broader downtrend resumes.
Trigger: < $1.71
Conclusion: Decision at $2.17
The technical setup is constructive, but not yet confirmed. The decisive area is the resistance zone around $2.17, which separates a short-term recovery from a meaningful trend shift.
If buyers manage to break through with stronger volume, the path toward $2.33 opens and the longer-term picture brightens noticeably. If the level holds the bulls back and price slides under $1.71, the rally risks turning into a fake-out with $1.57 as the next downside reference. The next few trading days are likely to set the direction.
Want to buy Cosmos? Kraken is our recommended crypto trading platform.
Continue to KrakenSince 2017, Philipp Duringer has been deeply involved in Bitcoin, crypto assets and digital financial markets. As the founder of Coinbird, he combines years of crypto experience with more than 15 years of technical experience in IT and digital products. His goal is to make crypto easier to understand, more transparent and easier to compare.
About the authorAI-assisted: This price analysis is generated automatically based on structured market data and reviewed through defined quality rules. It is for informational purposes only and is not financial or investment advice or a recommendation to buy or sell crypto assets.