This Zcash price analysis was published on and is not the latest edition.
Zcash is coming under pressure and has dropped nearly 28% over the past week, falling far below the 50-day moving average. The MACD remains clearly bearish, while volume is elevated as sellers push the price lower. If the next support zone does not hold, the correction could extend further.
Key takeaways in a nutshell
Sharp pullback: Zcash trades near $398, down roughly 28% over the past 7 days.
Trend turns fragile: Price sits 18% below the 50-day average but still 4.7% above the 200-day line.
Support in focus: The $224 zone is the next key reference if selling pressure continues.
Momentum weakens: RSI at 36 shows clear weakness, while MACD remains firmly bearish.
AI sees wide range: The model projects a 2026 range from $446 to $898, with broad uncertainty.
What happened to the Zcash price?
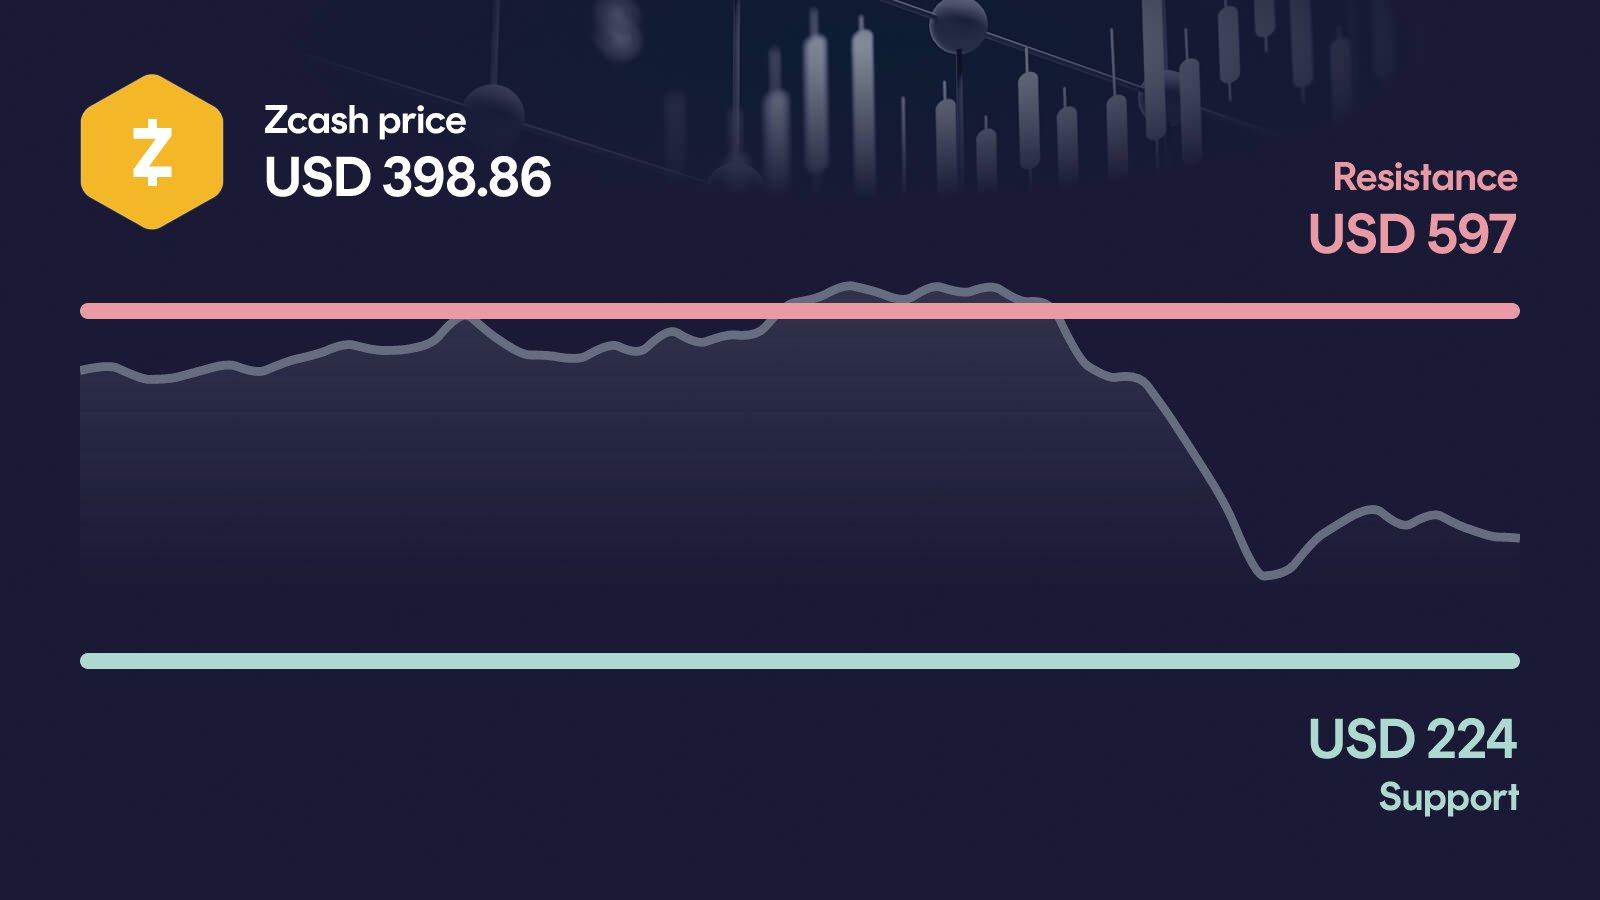
Zcash is trading around $398, after losing nearly 28% in the past 7 days and around 30% over the past 30 days. The weekly high near $638 now feels far away, and the price has fallen sharply from the monthly high of $686.
The most notable signal is volume: 24-hour turnover sits at $1.18 billion, about 35% above the 30-day average. Elevated activity during a sell-off is rarely a comforting sign, it suggests that sellers are still in control and that the move down is being carried by real flow, not thin liquidity.
Key price levels for Zcash
These are the key zones now: The resistance at $597 is the next major hurdle, and only a move above it would put the bulls back in control. On the downside, the area around $224 acts as the primary support. If Zcash loses this zone, the next relevant reference sits much lower around $57, which would mark a far deeper structural break.
Zcash indicators: RSI, MACD and volume
The three indicators currently paint a consistent picture, and that picture is not friendly. The RSI at 36 sits in the lower half of the range, signaling clear weakness without yet reaching oversold extremes. The MACD is bearish at -3.14, with a histogram that has deepened sharply in recent sessions, confirming that downside momentum is accelerating rather than fading. Volume is running about 35% above the 30-day average, which during a decline typically reflects active selling rather than accumulation. Taken together, the signals point to a market where sellers still hold the upper hand and a quick reversal would need a clear catalyst.
Relative Strength Index
MACD
AI forecast for Zcash
Looking toward year-end 2026, our AI forecast model places Zcash in a wide range from $446 to $898. The central expected value sits near $665, but this is not a price target, rather the midpoint of a broad probability distribution.
Given the current volatility and the sharp pullback, the range itself is more informative than the midpoint. In the conservative case, the model still sees roughly +12.7% upside from current levels, while the optimistic case implies around +127%. That spread reflects how undecided the medium-term setup is: the trend has cooled, but Zcash is still up sharply over the past year.
What could happen now?
Bullish scenario
For the bullish case, Zcash would need to reclaim the $597 resistance on convincing volume. A move back above the 50-day average near $488 would be a first step, but only a sustained push through $597 would meaningfully improve the short-term setup. The RSI would need to recover from its current weakness without overheating, and the MACD histogram would have to turn back upward. Importantly, the $224 support must not be retested in the meantime, otherwise the structure stays fragile.
Trigger: > $597 with elevated volume
Bearish scenario
The bearish case becomes active if Zcash loses the $224 primary support. In that scenario the short-term setup would deteriorate quickly, with the 200-day average likely failing as a buffer. The next relevant reference on the downside sits near $57, which is a far deeper structural level. A break of $224 would also put serious pressure on the medium-term trend, since the market would then need to show whether demand returns at much lower levels.
Trigger: < $224
Conclusion: $224 level decides the direction
The technical setup is fragile, but Zcash is still holding above the 200-day average for now. The decisive area is the band between the $224 support and the $597 resistance.
If buyers manage to reclaim $597, the recent sell-off could be reframed as a sharp shakeout within a still-intact longer-term uptrend. If $224 breaks instead, the move toward the next reference near $57 would come into focus and the medium-term picture would darken noticeably. The next few trading days are likely to set the direction.
Want to buy Zcash? Kraken is our recommended crypto trading platform.
Continue to KrakenSince 2017, Philipp Duringer has been deeply involved in Bitcoin, crypto assets and digital financial markets. As the founder of Coinbird, he combines years of crypto experience with more than 15 years of technical experience in IT and digital products. His goal is to make crypto easier to understand, more transparent and easier to compare.
About the authorAI-assisted: This price analysis is generated automatically based on structured market data and reviewed through defined quality rules. It is for informational purposes only and is not financial or investment advice or a recommendation to buy or sell crypto assets.