This Cardano price analysis was published on and is not the latest edition.
Cardano is in a sharp sell-off, losing nearly 32% in a week and falling to $0.1603. The RSI has crashed to 20, volume is up over 175% versus the 30-day average, and price has broken clean below the primary support zone. If the $0.15 area gives way, the next leg lower could open up quickly.
Key takeaways in a nutshell
Heavy sell-off: ADA trades at $0.1603 after a 17% drop in 24 hours and a 32% weekly loss.
Trend deeply broken: Price sits 35% below the 50-day MA at $0.25 and nearly 48% below the 200-day at $0.311.
Support under fire: The $0.175 zone has already cracked, leaving $0.15 as the last defensive line.
RSI in capitulation: With RSI at 20, momentum is deeply oversold but offers no reversal signal yet.
AI sees room above: The model places year-end 2026 between $0.23 and $0.38, well above current levels.
What happened to the Cardano price?
Cardano is trading at $0.1603 after a brutal 24-hour drop of more than 17%. Over the past week, ADA has lost nearly 32%, and the 30-day balance now sits at roughly -39%. The weekly high near $0.239 already feels like a distant memory.
The most notable signal is volume: at $1.14 billion in 24 hours, it stands more than 175% above the 30-day average. That kind of turnover during a sharp decline points to active distribution rather than quiet drift, and it confirms that sellers are firmly in control.
Key price levels for Cardano
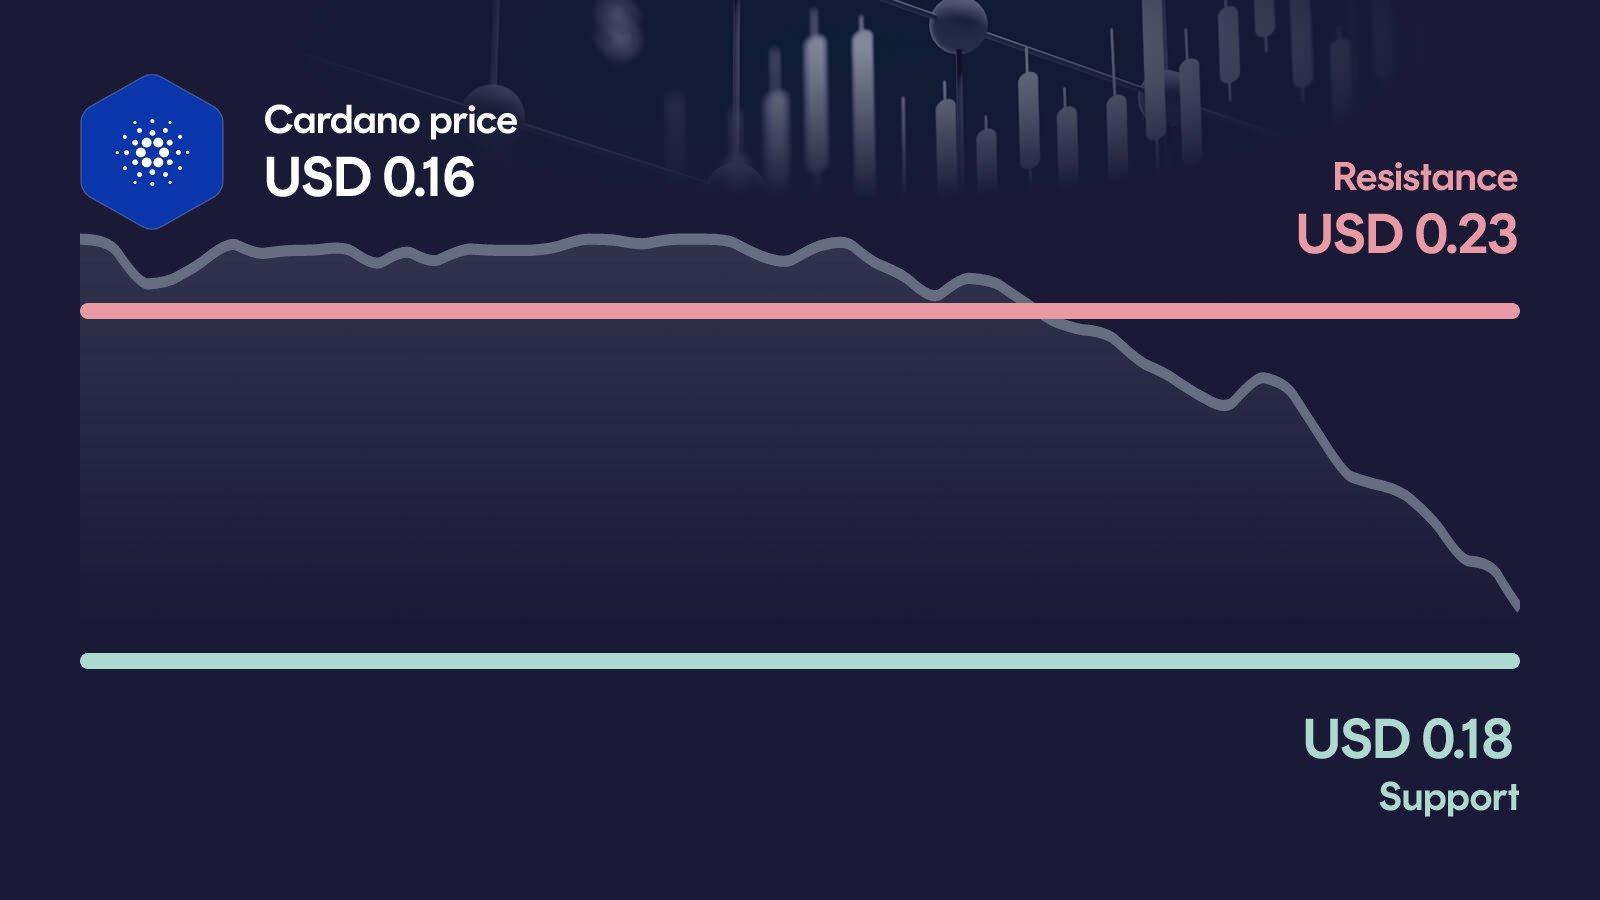
These are the key zones now: The resistance at $0.226 is the first major hurdle, and only a reclaim of this area would start to repair the broken structure. On the downside, the area around $0.175 acts as support, but with price already trading below it, that zone is at risk of being lost. If Cardano cannot stabilize here, the next relevant reference is the secondary support near $0.15.
Cardano indicators: RSI, MACD and volume
The three indicators currently paint a consistent and clearly bearish picture. The RSI at 20 is deep in oversold territory, which signals extreme weakness but, on its own, is not a reversal trigger. The MACD remains bearish with a negative value and a histogram that has turned more negative again over the most recent readings, confirming that downside momentum is accelerating rather than fading. Volume sits more than 175% above the 30-day average, which during a sell-off typically reflects forced selling and panic exits. Taken together, the setup points to capitulation conditions, but not yet to a stabilization.
Relative Strength Index
MACD
AI forecast for Cardano
Looking toward year-end 2026, our AI forecast model places Cardano in a range between $0.233 and $0.384. The central expected value sits near $0.299, but this is not a price target: it is the midpoint of a broad probability distribution that reflects how much uncertainty currently surrounds ADA.
Given how sharply the price has fallen, the range matters more than the single number in the middle. In the conservative case, the model still implies an upside of roughly +45.7% from current levels, while the optimistic case points to about +140.3%. Both ends sit well above today's price, which highlights how stretched the recent move has become relative to longer-term expectations.
What could happen now?
Bullish scenario
For the bulls to regain any control, ADA would first need to stabilize above $0.175 and then push back through the resistance at $0.226 on strong volume. In that case, the deeply oversold RSI could turn into a genuine relief signal, and the MACD histogram would need to start contracting toward the zero line. As long as the move is supported by sustained turnover and the RSI does not immediately overheat, the structure would slowly begin to repair. The key condition: the $0.175 area should not be lost again once reclaimed.
Trigger: > $0.226 with elevated volume
Bearish scenario
The bearish case is already in motion. If Cardano fails to defend the $0.15 secondary support, the short-term setup deteriorates further and the sell-off could accelerate. With the MACD histogram turning more negative again and volume confirming distribution, there is little technical evidence of buyers stepping in yet. A sustained break below $0.15 would leave ADA without a clear reference level nearby and would put even more pressure on the already broken medium-term trend below the 200-day MA at $0.311.
Trigger: < $0.15
Conclusion: $0.15 level decides the direction
The technical setup is clearly weak, but the extreme RSI reading shows just how stretched the move already is. The decisive area is the $0.15 support zone, which now stands between an oversold bounce and a deeper breakdown.
If this level holds and ADA can reclaim $0.175, a relief move toward the $0.226 resistance becomes plausible. If $0.15 breaks on continued high volume, the sell-off is likely to extend and the broken trend structure would weigh further on price. The next few trading days are likely to set the direction.
Want to buy Cardano? Kraken is our recommended crypto trading platform.
Continue to KrakenSince 2017, Philipp Duringer has been deeply involved in Bitcoin, crypto assets and digital financial markets. As the founder of Coinbird, he combines years of crypto experience with more than 15 years of technical experience in IT and digital products. His goal is to make crypto easier to understand, more transparent and easier to compare.
About the authorAI-assisted: This price analysis is generated automatically based on structured market data and reviewed through defined quality rules. It is for informational purposes only and is not financial or investment advice or a recommendation to buy or sell crypto assets.