
This Bitcoin price analysis was published on and is not the latest edition.
Bitcoin is under heavy pressure and sliding toward the key support zone near $55,400. The MACD histogram keeps deepening, the RSI has collapsed into extreme oversold territory, and volume offers no real defense. If this support breaks, the correction could accelerate sharply toward the next downside reference.
Key takeaways in a nutshell
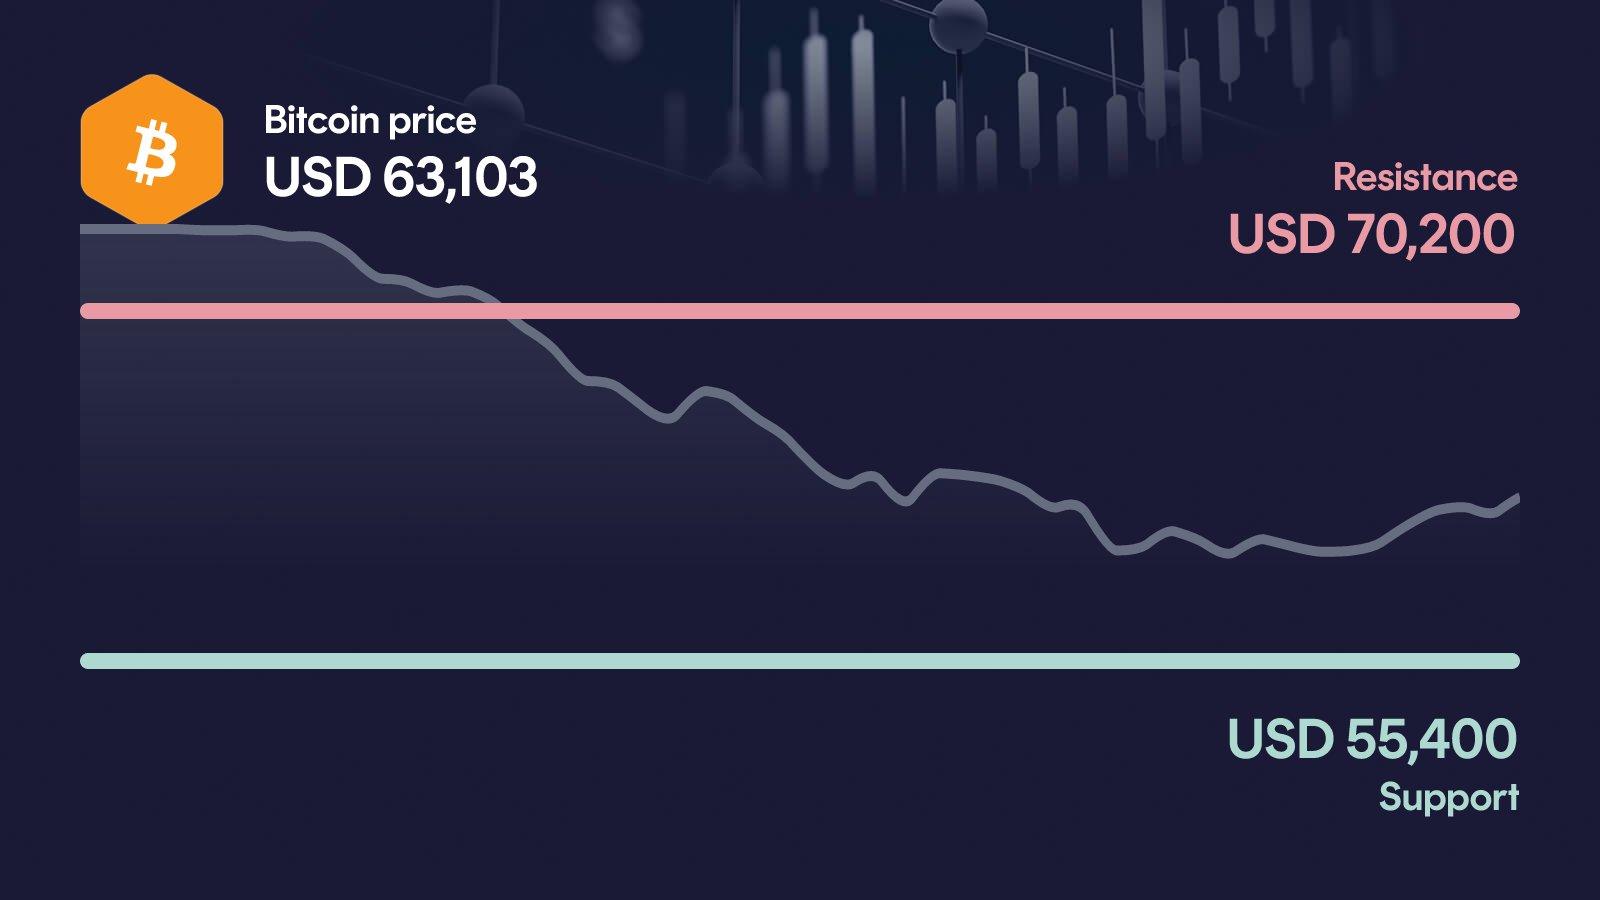
Pressure intensifies: Bitcoin trades at $63,103, down more than 13% on the week and over 21% in 30 days.
Trend clearly broken: Price sits roughly 17% below the 50-day average and nearly 20% below the 200-day line.
Support in focus: The zone around $55,400 is now the decisive line in the sand for bulls.
Momentum collapsed: RSI at 15 signals an extreme oversold condition, while the MACD keeps deepening.
AI sees recovery room: The forecast model places BTC between $66,171 and $98,716 by year-end 2026.
What happened to the Bitcoin price?
Bitcoin is trading at $63,103, after losing more than 13% in the past week and over 21% in the last 30 days. The weekly high near $74,100 already feels distant, and the move has dragged price far below both major moving averages. On a yearly basis, BTC is down around 40%, which underlines how aggressively the trend has shifted.
The most notable signal sits in volume: at roughly $35.5 billion, turnover is almost exactly in line with the 30-day average. That is the analytical highlight here — sellers are pushing price lower without any obvious panic spike, which suggests the weakness is structural rather than a one-off flush.
Key price levels for Bitcoin
These are the key zones now: The resistance at $70,200 is the next major hurdle, and only a reclaim above it would meaningfully ease the bearish pressure. On the downside, the area around $55,400 acts as primary support and is the critical line bulls need to defend. If Bitcoin loses that zone, the next relevant reference shifts down toward $49,900, where a deeper leg of the correction would come into play.
Bitcoin indicators: RSI, MACD and volume
The three indicators currently paint a consistent and clearly bearish picture. The RSI at 15 is in extreme oversold territory, which signals exhaustion but also a market that has been sold aggressively without buyers stepping in. The MACD remains bearish at -3,922, with a histogram that keeps expanding to the downside, confirming that downside momentum is still accelerating rather than fading. Volume sits about 2% below the 30-day average, so the sell-off is happening on normal turnover, not on a capitulation spike. Taken together, the indicators describe a market under sustained pressure where oversold readings alone are not yet a reversal signal.
Relative Strength Index
MACD
AI forecast for Bitcoin
Looking toward year-end 2026, our AI forecast model places Bitcoin in a wide range between $66,171 and $98,716. The central expected value sits near $80,822, but this number is not a price target — it is the midpoint of a broad probability distribution and should be read as such. Given how oversold the market currently is, that range matters far more than any single point estimate.
In the conservative case, the model implies a recovery of roughly 4.9% from current levels, while the optimistic case points to upside of about 56.5%. The wide spread reflects exactly the uncertainty visible in the chart: the trend is broken, momentum is deeply negative, but extreme oversold readings keep the door open for a sharp counter-move. For now, the data still leans toward caution before any of that recovery potential can materialize.
What could happen now?
Bullish scenario
A bullish setup would require Bitcoin to reclaim $70,200 on clearly above-average volume. In that case, the extreme oversold RSI could finally translate into a real relief rally rather than a short bounce, and the MACD histogram would need to start contracting to confirm the shift. Ideally, volume picks up alongside the move, signaling that buyers are actively stepping in rather than shorts simply covering. To keep the recovery intact, price should then not fall back below the $63,000 area, otherwise the attempt would quickly look like another failed bounce.
Trigger: > $70,200 with elevated volume
Bearish scenario
The bearish case activates if Bitcoin loses the $55,400 support on a sustained basis. The setup would then deteriorate further: a deeply negative MACD combined with a broken support zone typically opens room for accelerated downside, even from oversold conditions. The next reference level would shift toward $49,900, where the secondary support comes into play. A break of that area would put significant additional pressure on the medium-term trend, which is already well below both the 50-day and 200-day moving averages.
Trigger: < $55,400
Conclusion: $55,400 level decides the direction
The technical setup is clearly fragile, but the extreme oversold reading on the RSI shows how stretched the move has already become. The decisive area is the support zone around $55,400, which now defines the next chapter of this correction.
If that level holds and Bitcoin manages to reclaim $70,200, the door opens for a meaningful relief move from deeply oversold conditions. If support breaks, however, the path toward $49,900 becomes the dominant reference, and the broader trend damage would deepen further. The next few trading days are likely to set the direction.
Want to buy Bitcoin? Kraken is our recommended crypto trading platform.
Continue to KrakenSince 2017, Philipp Duringer has been deeply involved in Bitcoin, crypto assets and digital financial markets. As the founder of Coinbird, he combines years of crypto experience with more than 15 years of technical experience in IT and digital products. His goal is to make crypto easier to understand, more transparent and easier to compare.
About the authorAI-assisted: This price analysis is generated automatically based on structured market data and reviewed through defined quality rules. It is for informational purposes only and is not financial or investment advice or a recommendation to buy or sell crypto assets.