
The Sandbox is on fire: SAND rockets 66% in 24 hours to $0.0723, blasting through every resistance on the chart with volume more than 12x the 30-day average. MACD confirms the bullish shift, RSI still has room at 58, and price now trades well above both the 50-day and 200-day moving averages. The question now: is this the start of a sustained breakout, or will profit-taking drag SAND back toward the old resistance zone?
Key takeaways in a nutshell
Explosive 24h move: SAND jumps 66% in a single day to $0.0723, with volume at $327M running 1,207% above the 30-day average.
Trend fully flipped: Price trades 80% above the 50-day MA ($0.0402) and 23% above the 200-day MA ($0.0587), a clear bullish structure.
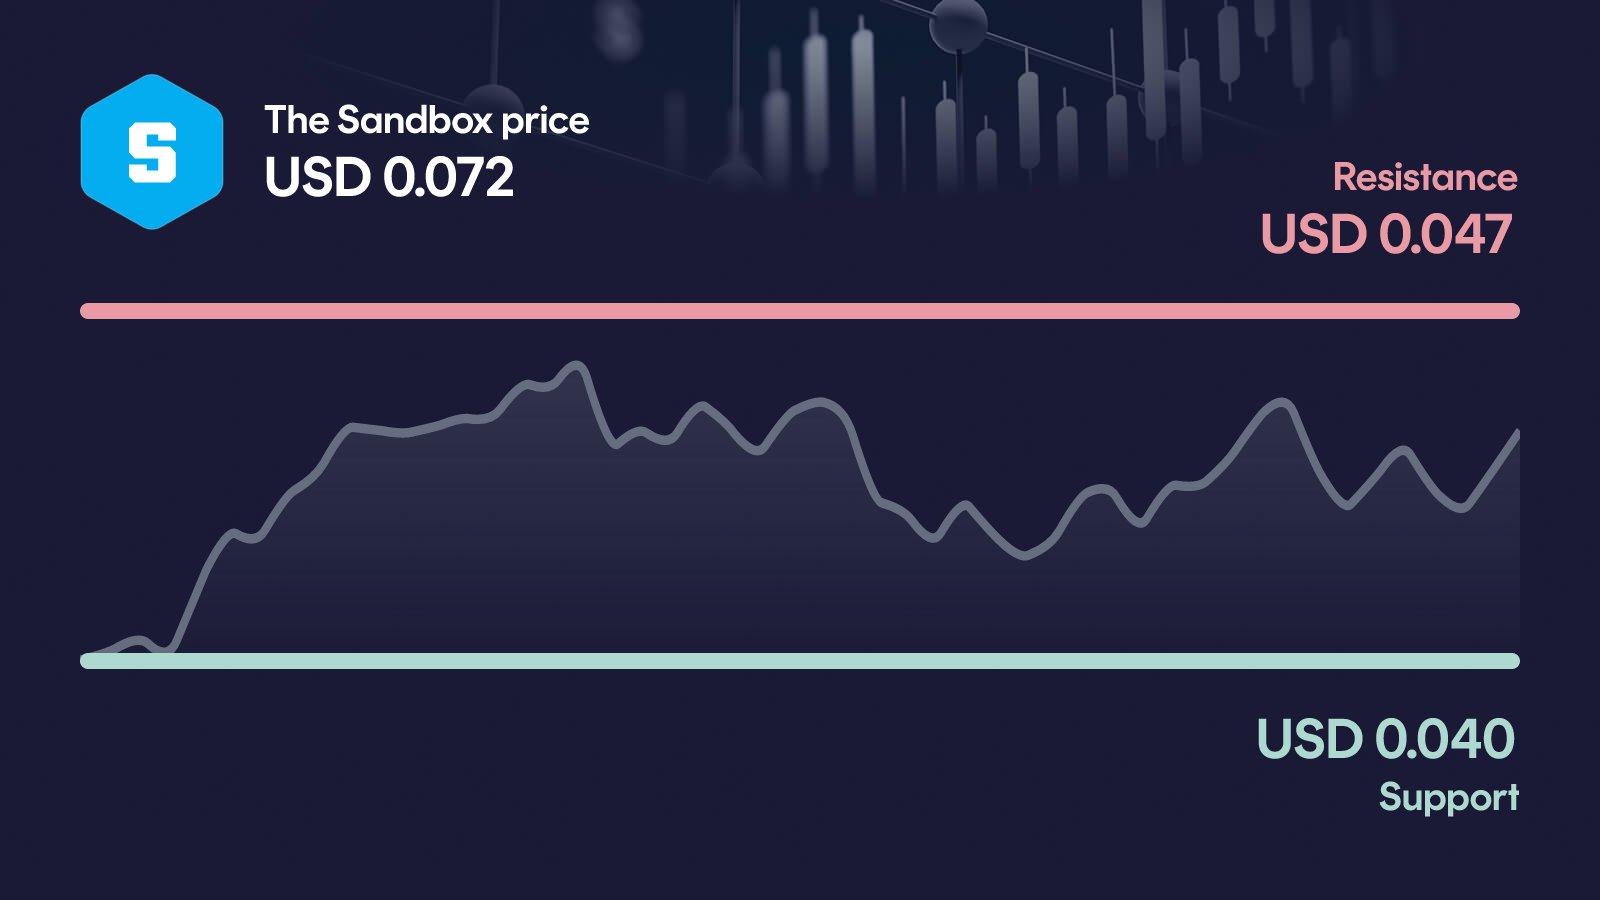
Resistance left behind: The former resistance at $0.0472 is now the key reclaim zone bulls need to defend to validate the breakout.
Momentum healthy: RSI at 58 shows strong momentum without overheating, leaving room for further upside before exhaustion signals appear.
AI sees broad range: The AI model projects a 2026 year-end range of $0.045 to $0.082, with the midpoint sitting slightly below current levels.
What happened to the The Sandbox price?
The Sandbox just delivered one of its loudest moves in months. SAND trades at $0.0723, up 66% in 24 hours and 61% on the week, after breaking cleanly above every short-term reference level on the chart. The 30-day performance now stands at +94%, pulling the token decisively out of its recent consolidation.
The real story sits in the volume column: $327 million in daily turnover, more than 12 times the 30-day average. A move of this size, backed by this much participation, is not a quiet rotation. It is a repricing event, and the market is clearly paying attention.
Key price levels for The Sandbox
The former resistance at $0.0472 has been overrun, with the next structural ceiling at $0.0505: a clean daily close above that level would open significant upside room. On the downside, the prior resistance zone around $0.0472 now flips into first support, and losing it would quickly reopen the discussion around $0.0401. Below that, the next orientation sits at $0.0326, which would mark a full retracement of the breakout.
The Sandbox indicators: RSI, MACD and volume
The three indicators currently paint a consistent bullish picture. RSI at 58 signals strong momentum but is still well short of overbought territory, leaving headroom for further gains. MACD is bullish with a positive value of 0.0014 and a histogram that has been expanding steadily for the past two weeks, confirming that the trend has real engine behind it. Volume is the loudest voice in the room: at 1,207% above the 30-day average, participation is extreme and classifies as decisively above average. Together, the three readings suggest the breakout is not just a wick, but a move with genuine conviction behind it.
Relative Strength Index
MACD
AI forecast for The Sandbox
Looking toward year-end 2026, our AI forecast model places SAND in a range between $0.0450 on the conservative side and $0.0821 on the optimistic side. The central expected value sits at $0.0608: not a price target, but the midpoint of a broad probability distribution.
The spread itself is the key message. A range this wide reflects the uncertainty around whether today's breakout turns into a sustained trend or fades back into the prior range. In the conservative scenario, SAND would trade about 32.8% below the current level; in the optimistic case, roughly 22.5% above. For a token that just moved 66% in a day, that spread is actually tight by comparison.
What could happen now?
Bullish scenario
A daily close above $0.0505 with volume staying meaningfully above average would confirm the breakout and open the next leg higher. The setup requires RSI to climb further without tipping into overbought extremes, and the MACD histogram should continue to hold its positive expansion rather than roll over. Participation is the key ingredient: today's volume surge needs follow-through, not a one-day spike that fades. As long as $0.0472 holds as new support on any pullback, the bullish structure remains intact.
Trigger: > $0.0505 with elevated volume
Bearish scenario
If SAND loses the reclaimed $0.0472 zone and slips back below $0.0401, the breakout narrative would quickly deflate. Momentum readings would weaken, the MACD histogram would likely contract, and the volume spike would start looking like exhaustion rather than accumulation. The next orientation below support sits at $0.0326, which also marks the 30-day low. A move back into that area would put the medium-term trend recovery back in question and hand control back to sellers.
Trigger: < $0.0401
Conclusion: Decision at $0.0505
The technical setup is constructive, but the move is so sharp that follow-through becomes the critical variable. The decisive area sits between $0.0472 as new support and $0.0505 as the next ceiling.
A clean breakout above $0.0505 with sustained volume would confirm that today's surge is more than a one-day event and open the path toward the AI model's upper range. A failure to hold $0.0472, on the other hand, would reopen the door to $0.0401 and potentially $0.0326, turning the breakout into a classic blow-off. The next few trading days are likely to set the direction.
Want to buy The Sandbox? Kraken is our recommended crypto trading platform.
Continue to KrakenSince 2017, Philipp Duringer has been deeply involved in Bitcoin, crypto assets and digital financial markets. As the founder of Coinbird, he combines years of crypto experience with more than 15 years of technical experience in IT and digital products. His goal is to make crypto easier to understand, more transparent and easier to compare.
About the authorAI-assisted: This price analysis is generated automatically based on structured market data and reviewed through defined quality rules. It is for informational purposes only and is not financial or investment advice or a recommendation to buy or sell crypto assets.