
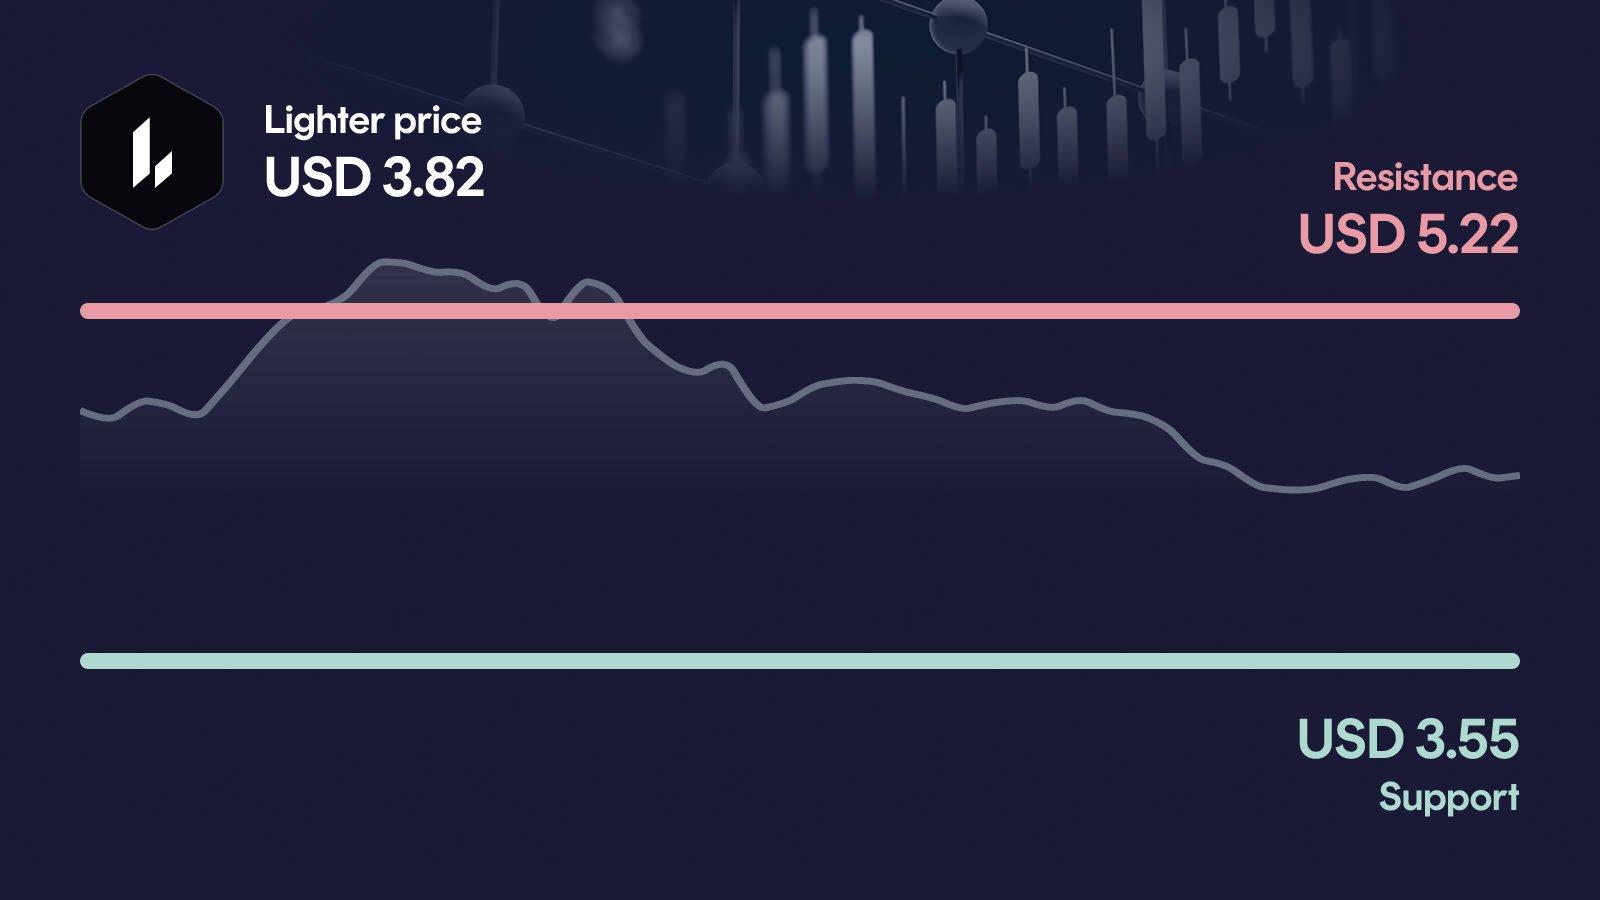
Lighter comes under heavy pressure: LIT drops more than 15% in 24 hours and slips toward the key support at $3.55. Volume has more than tripled its 30-day average, and MACD has turned bearish while RSI sits exactly at the neutral 50 line. What matters now: whether $3.55 holds or opens the door to $3.39.
Key takeaways in a nutshell
Sharp sell-off: LIT trades at $3.822, down 15.1% in 24 hours and down 29.9% over the past week.
Trend split: Price sits 0.5% below the 50-day average at $3.84 but still 84.6% above the 200-day at $2.07.
Support in focus: The zone around $3.55 is the decisive line: below it, $3.39 becomes the next reference.
Momentum cooling: RSI has cooled to a neutral 50, while MACD has flipped to a bearish signal.
AI range 2026: The AI forecast model spans $4.26 to $7.03 for year-end 2026, with a midpoint near $5.75.
What happened to the Lighter price?
Lighter has been hit hard: LIT is trading at $3.822, down 15.1% in 24 hours and 29.9% over the last seven days. The move has pushed price directly toward the weekly low at $3.65 and within reach of the primary support at $3.55, after the token had recently traded as high as $5.54 on the week.
What stands out is the volume: 24-hour turnover of roughly $313 million sits 224% above the 30-day average. That kind of expansion on a down day signals real selling pressure rather than a quiet drift lower, even as the 30-day performance still shows a modest gain of 6.7%.
Key price levels for Lighter
On the upside, the primary resistance sits at $5.22; a reclaim of that level would put the weekly high near $5.54 and the secondary resistance at $5.99 back in play. On the downside, the primary support at $3.55 is the decisive line, because it aligns closely with the weekly low at $3.65 and marks the last defended zone before further downside opens up. If $3.55 breaks, the next relevant reference is the 30-day low at $3.39, followed by the deeper secondary support at $2.78.
Lighter indicators: RSI, MACD and volume
The three indicators currently paint a mixed but tilted picture. RSI stands exactly at 50, meaning momentum is neither oversold nor overbought, but has clearly cooled from the recent highs. MACD has turned bearish, and the histogram sequence shows momentum rolling back into negative territory after a brief improvement. Volume is the loudest signal: at 224% of the 30-day average, activity is well above normal, which underlines that the current sell-off is being carried by real flows. Taken together, the picture leans defensive: neutral momentum, a bearish trigger, and heavy volume on the way down.
Relative Strength Index
MACD
AI forecast for Lighter
Looking toward year-end 2026, our AI forecast model places Lighter in a range from $4.26 to $7.03. The central expected value sits near $5.75, but this is not a price target: it is the midpoint of a broad probability distribution.
That spread matters, because it captures the still-wide uncertainty around LIT after a volatile stretch. In the conservative case, the model implies roughly 10.6% upside from the current $3.822, while the optimistic case corresponds to about 82.3% upside. The width of the range is itself the message: the market still needs to decide whether the recent pullback is a healthy reset or the start of a deeper correction.
What could happen now?
Bullish scenario
A bullish setup would need LIT to first stabilize above the $3.55 support and then reclaim the 50-day average around $3.84. A sustained push above the primary resistance at $5.22 with elevated volume would open the path back toward the weekly high near $5.54 and the secondary resistance at $5.99. For confirmation, RSI should climb back above 50 without overheating, and MACD should turn back to positive to validate a shift in momentum. The key hold condition: $3.55 must not be lost again once reclaimed.
Trigger: > $5.22 with elevated volume
Bearish scenario
The bearish setup activates if LIT loses the $3.55 support on a clean move. In that case, the 30-day low at $3.39 becomes the next reference, and a break below it would leave the deeper secondary support at $2.78 as the following orientation. Momentum would confirm the weakness if RSI slides below 50 and MACD extends its bearish reading with expanding negative histogram bars. A sustained close below $3.39 would put additional pressure on the medium-term trend that has so far held well above the 200-day average.
Trigger: < $3.55
Conclusion: $3.55 level decides the direction
The technical setup is fragile in the short term, but the broader trend structure with price still 84.6% above the 200-day average has not been broken. The decisive area is the zone between $3.55 support and the $5.22 resistance.
If $3.55 holds and buyers manage to push back above the 50-day average, the setup can quickly turn constructive again toward $5.22 and the weekly high near $5.54. If $3.55 breaks on continued heavy volume, $3.39 becomes the next test, with $2.78 as the deeper reference. The next few trading days are likely to set the direction.
Want to buy Lighter? Kraken is our recommended crypto trading platform.
Continue to KrakenSince 2017, Philipp Duringer has been deeply involved in Bitcoin, crypto assets and digital financial markets. As the founder of Coinbird, he combines years of crypto experience with more than 15 years of technical experience in IT and digital products. His goal is to make crypto easier to understand, more transparent and easier to compare.
About the authorAI-assisted: This price analysis is generated automatically based on structured market data and reviewed through defined quality rules. It is for informational purposes only and is not financial or investment advice or a recommendation to buy or sell crypto assets.