
Tezos is back in the spotlight: XTZ jumps almost 20% in a single day and now presses against a decisive resistance zone around $0.329. Momentum is building, with volume above the 30-day average and MACD flipping bullish. The question now: is this the start of a real breakout, or just another rejection at the same wall?
Key takeaways in a nutshell
Explosive daily move: XTZ trades at $0.3058 after a 19.6% surge in 24 hours, pushing the coin up almost 40% over the last 30 days.
Trend structure improves: Price sits 37.7% above the 50-day average at $0.222 and just above the 200-day at $0.293, a rare constellation for Tezos this year.
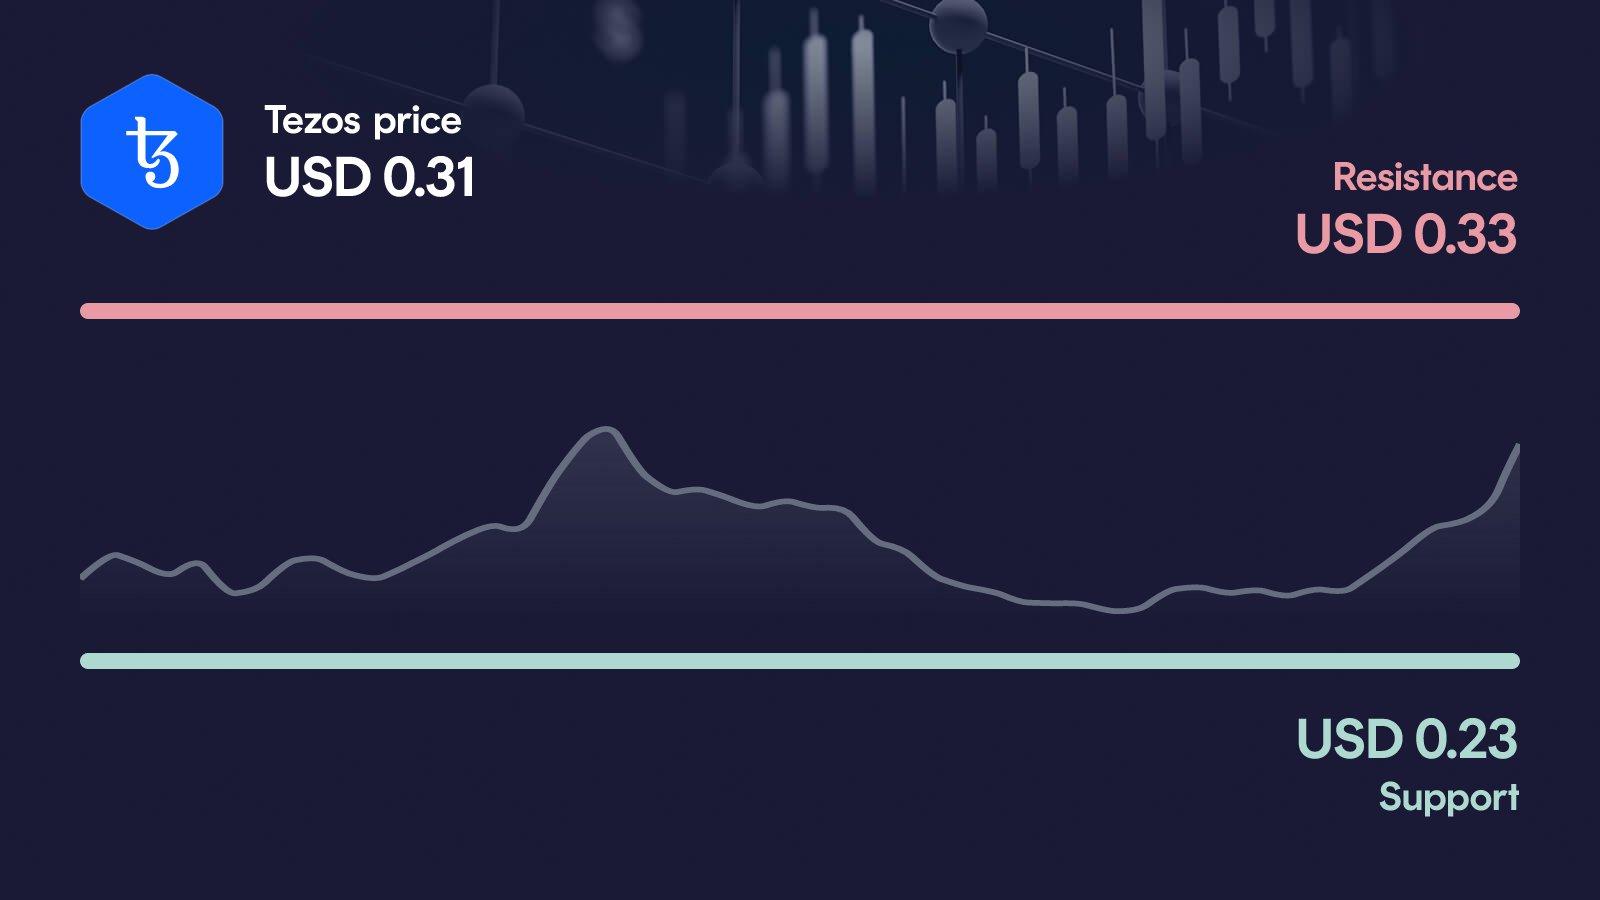
Resistance at $0.329: The area around $0.329 is the decisive lid. A clean move above opens the path toward $0.355.
Momentum still has room: RSI sits at 56, MACD is bullish at 0.011 and volume runs 18.8% above the 30-day average, a supportive but not overheated mix.
AI sees room to run: Our AI forecast places XTZ between $0.90 and $1.65 by year-end 2026, with a central value of $1.22.
What happened to the Tezos price?
Tezos explodes higher: XTZ jumps 19.6% in 24 hours to $0.3058 and is now knocking on the door of the weekly high at $0.303. The move extends a broader recovery, with the coin up 18.7% over seven days and nearly 40% over the last 30 days.
What makes the current move interesting is that it is not happening in a vacuum. Trading volume of roughly $14.1 million sits about 18.8% above the 30-day average, showing that buyers are actually stepping in rather than just chasing thin liquidity. After a long stretch of weakness, XTZ has clawed its way back above both the 50-day and the 200-day moving average.
Key price levels for Tezos
The first serious hurdle sits at $0.329: a clean daily close above this level would open the path toward the next resistance at $0.355 and confirm the current momentum. On the downside, the primary support runs at $0.229, the area that carried the recent recovery and now serves as the line the bulls need to defend. If that zone breaks, the next relevant reference is the secondary support around $0.203, close to the monthly low at $0.199.
Tezos indicators: RSI, MACD and volume
The three indicators currently paint a consistent, constructive picture. The RSI at 56 sits in neutral-bullish territory: momentum is clearly positive, but far from overbought, which leaves room for further upside. The MACD is bullish at 0.011, with a histogram that has been positive for weeks, confirming that the underlying trend has genuinely shifted. Volume runs 18.8% above the 30-day average, showing that the rally is backed by real participation rather than a thin squeeze. Taken together, the setup looks supportive for another attempt at the $0.329 resistance, without yet showing signs of exhaustion.
Relative Strength Index
MACD
AI forecast for Tezos
Looking toward year-end 2026, our AI forecast model places Tezos in a wide range between $0.90 and $1.65. The central expected value sits at around $1.22, which is not a price target but the midpoint of a broad probability distribution. The width of the range reflects how uncertain the medium-term path for XTZ still is after a year in which the coin lost more than 60% of its value.
In the conservative case, the model still implies an upside of roughly 205% from the current price. In the optimistic case, the range points to a potential move of about 456%. Both numbers underline that, from a purely quantitative perspective, the risk/reward profile has shifted noticeably since XTZ reclaimed its 200-day average.
What could happen now?
Bullish scenario
The bullish setup activates on a daily close above $0.329, ideally paired with volume staying above the 30-day average. Such a move would confirm the breakout attempt, unlock the next resistance at $0.355 and turn the previous weekly high into a fresh support zone. For the picture to stay clean, RSI should not spike into overbought territory too quickly, and MACD should keep its bullish signal intact. As long as XTZ then defends the reclaimed $0.303 area on any pullback, the short-term trend structure remains constructive.
Trigger: > $0.329 with elevated volume
Bearish scenario
The bearish case begins if XTZ fails at the $0.329 resistance and slides back below the primary support at $0.229. That would invalidate a large part of the recent recovery and drag the short-term structure back into a downtrend. The next relevant reference sits at $0.203, right above the monthly low of $0.199, an area that would come into focus fast if support gives way. A break of that zone would put serious pressure on the medium-term trend and question the reclaim of the 200-day average.
Trigger: < $0.229
Conclusion: Decision at $0.329
The technical setup is constructive, but XTZ now stands exactly at the level that has capped previous attempts. The decisive area is the zone between $0.303 and $0.329.
A clean breakout with sustained volume would open the path toward $0.355 and confirm that the trend reversal is more than a short-term bounce. A rejection at this resistance, followed by a break below $0.229, would quickly bring the $0.203 area back into play. The next few trading days are likely to set the direction.
Want to buy Tezos? Kraken is our recommended crypto trading platform.
Continue to KrakenSince 2017, Philipp Duringer has been deeply involved in Bitcoin, crypto assets and digital financial markets. As the founder of Coinbird, he combines years of crypto experience with more than 15 years of technical experience in IT and digital products. His goal is to make crypto easier to understand, more transparent and easier to compare.
About the authorAI-assisted: This price analysis is generated automatically based on structured market data and reviewed through defined quality rules. It is for informational purposes only and is not financial or investment advice or a recommendation to buy or sell crypto assets.