Stellar is rallying hard and approaching the key resistance near $0.321 after a 54% weekly surge. Momentum, MACD and volume all support the move, but the RSI is already deep in overbought territory. Now the market has to show whether XLM can clear this zone or runs into a fake-out.
Key takeaways in a nutshell
Rally takes off: Stellar trades near $0.2291, up 54% in seven days and 44% in a month.
Trend turns up: Price sits 38% above the 50-day MA and 20% above the 200-day MA.
Breakout in focus: Above $0.321, the setup would shift from rally to confirmed breakout.
Momentum overheats: RSI at 74 signals overbought conditions, raising the risk of a short-term pullback.
AI sees upside room: By year-end 2026, the AI model places XLM between $0.22 and $0.50.
What happened to the Stellar price?
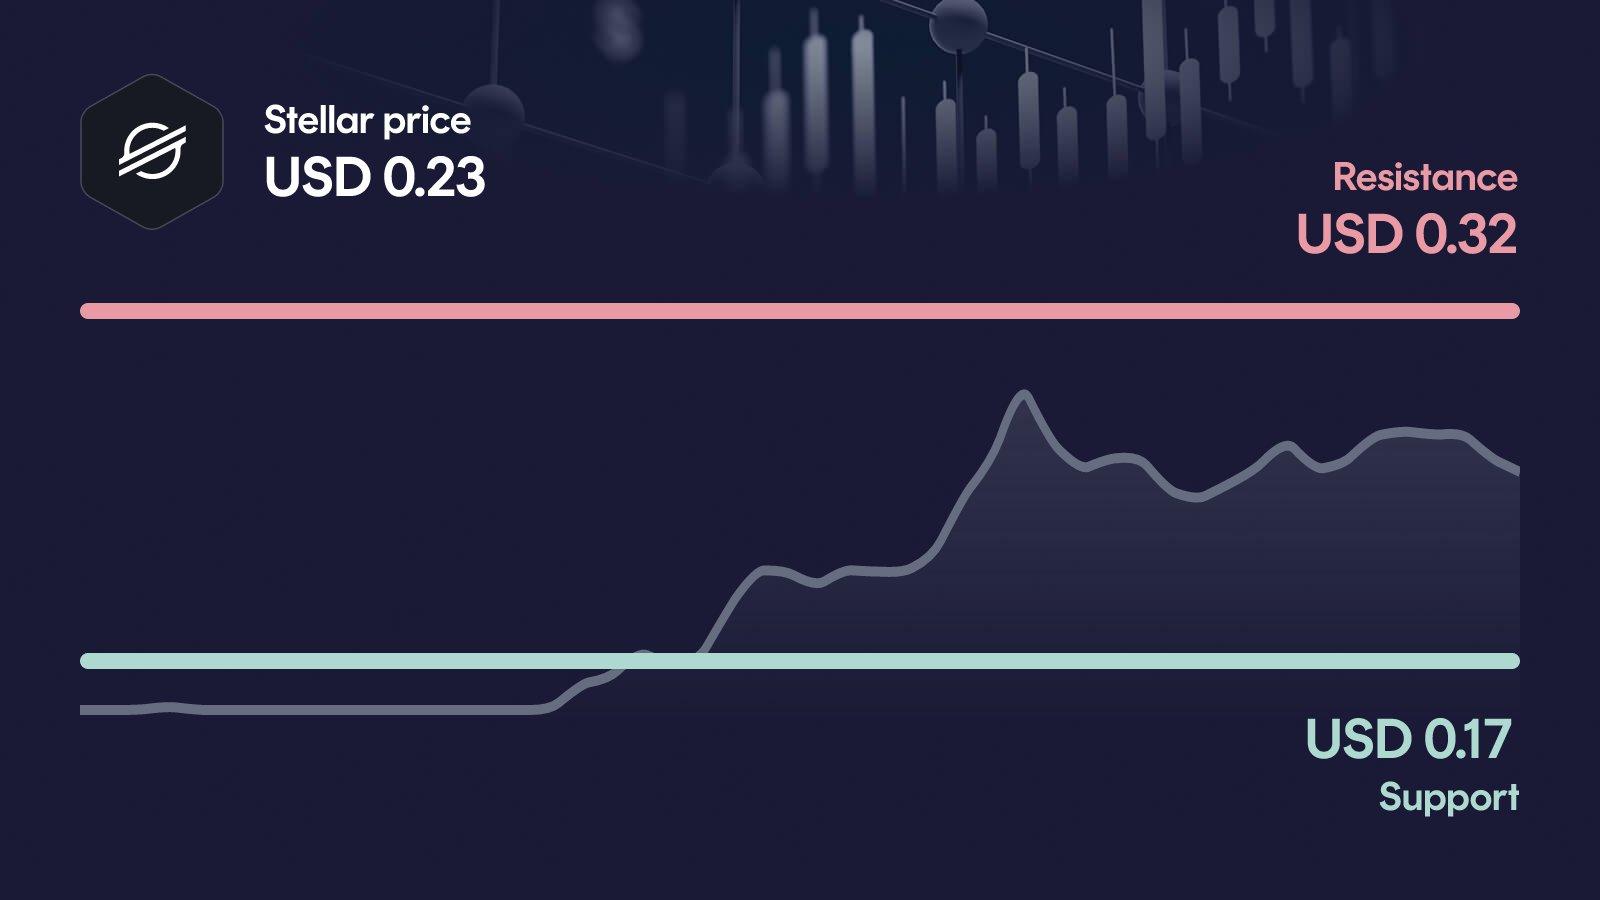
Stellar is trading at $0.2291, after a sharp 54% jump over the past week and a 44% gain in 30 days. The weekly high at $0.295 shows that buyers already attempted a larger push, but ran into resistance before consolidating slightly lower. Today's 24-hour move of -9.2% reflects a healthy cooldown after the rally rather than a trend reversal.
The most notable signal is volume: at $903 million, the 24-hour turnover sits 136% above the 30-day average. That is not a quiet drift higher, but a move backed by real participation, which gives the current setup more weight than a typical low-volume bounce.
Key price levels for Stellar
These are the key zones now: The resistance at $0.321 is the next major hurdle, and a clean move above it would confirm the breakout and open the path toward $0.383. On the downside, the area around $0.172 acts as primary support, defending the broader trend reversal. If Stellar falls below it, the next relevant reference point lies near the monthly low at $0.14.
Stellar indicators: RSI, MACD and volume
The three indicators currently paint a strongly bullish, but partly overheated picture. The RSI at 74 is in overbought territory, which warns that the move has run hot in the short term. The MACD is bullish, with the histogram clearly turning positive over the past sessions and confirming that momentum has shifted upward. Volume runs 136% above the 30-day average, which underlines real conviction behind the rally rather than a thin squeeze. Taken together, the signals support the upside bias, but the elevated RSI raises the odds of a near-term breather before any next leg higher.
Relative Strength Index
MACD
AI forecast for Stellar
Looking toward year-end 2026, our AI forecast model places Stellar in a range between $0.223 and $0.497. The central expected value sits at around $0.333, but this number should not be read as a price target. It is the midpoint of a broad probability distribution and reflects where the model sees the most likely cluster of outcomes.
What matters more than the midpoint is the width of the range itself, because it tells us how much uncertainty the model still prices in. In the conservative case, XLM would trade roughly 2.2% below today's level, while the optimistic case would translate into a gain of around 117%. That asymmetry shows that the model sees more potential upside than downside from current levels, but only if the technical setup holds.
What could happen now?
Bullish scenario
If Stellar pushes decisively above $0.321, the breakout would no longer look like a short-term impulse, but would be much better supported. The next reference would shift toward $0.383, and the broader trend reversal off the monthly lows would gain real credibility. For this to work, the RSI should cool off without breaking momentum, while the MACD and volume continue to back the move. The zone around $0.172 should not be lost again, as it now defines the foundation of the recovery.
Trigger: > $0.321 with elevated volume
Bearish scenario
The bearish case opens up if Stellar fails to defend the $0.172 support. In that case, the recent rally would look more like an exhaustion move, and the overheated RSI would turn from a warning into a confirmed signal. The next relevant reference would then sit near the monthly low at $0.14, where buyers would need to step in again. A break below that level would put serious pressure on the medium-term trend and call the entire recovery into question.
Trigger: < $0.172
Conclusion: Decision at $0.321
The technical setup is constructive, but the overheated RSI keeps the picture fragile in the short term. The decisive area is the resistance zone around $0.321, where the next directional decision will be made.
A clean break above this level with continued volume would confirm the breakout and open the path toward $0.383. A failure here, combined with a slide below $0.172, would expose Stellar to a deeper test near the monthly low at $0.14. The next few trading days are likely to set the direction.
Want to buy Stellar? Kraken is our recommended crypto trading platform.
Continue to KrakenSince 2017, Philipp Duringer has been deeply involved in Bitcoin, crypto assets and digital financial markets. As the founder of Coinbird, he combines years of crypto experience with more than 15 years of technical experience in IT and digital products. His goal is to make crypto easier to understand, more transparent and easier to compare.
About the authorAI-assisted: This price analysis is generated automatically based on structured market data and reviewed through defined quality rules. It is for informational purposes only and is not financial or investment advice or a recommendation to buy or sell crypto assets.