
This Ethereum price analysis was published on and is not the latest edition.
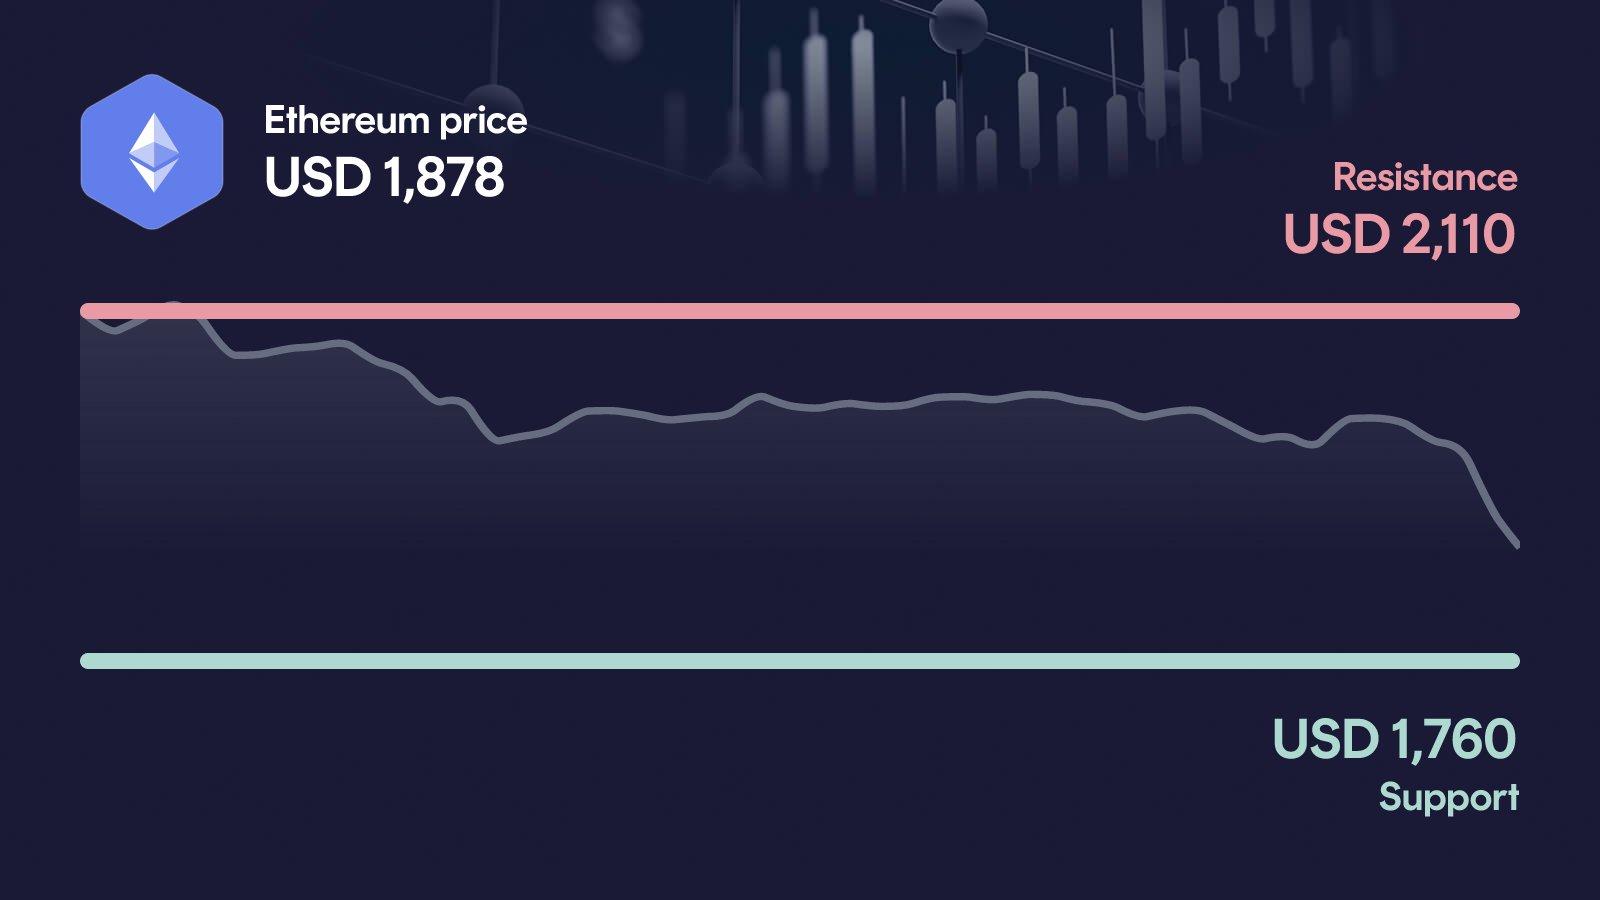
Ethereum is under pressure and trading near $1,878, with the $1,760 support coming into focus. The MACD remains bearish, the RSI is approaching oversold territory, and volume is well above average as sellers dominate. If support breaks, the correction risks accelerating further.
Key takeaways in a nutshell
Sellers in control: ETH trades at $1,878, down 9.6% on the week and over 20% in the last 30 days.
Trend clearly broken: Price sits 16% below the 50-day and nearly 25% below the 200-day moving average.
Support must hold: The $1,760 zone is the last meaningful line of defense before the setup deteriorates further.
Momentum stretched: With RSI at 31, ETH is close to oversold, but MACD confirms the bearish pressure.
AI sees upside: By year-end 2026, the model places ETH between $2,208 and $3,641, a wide range above current levels.
What happened to the Ethereum price?
Ethereum is trading around $1,878, after losing 4.97% in the last 24 hours and 9.57% over the past seven days. The 30-day performance looks even more uncomfortable: ETH has dropped roughly 20.7%, with the weekly high at $2,140 already feeling distant. Sellers have clearly dictated the recent action.
The most notable signal is volume: at $26.6 billion in 24 hours, turnover is running 79% above the 30-day average. That kind of activity in a falling market typically signals conviction on the sell side, not quiet distribution. Buyers have so far failed to absorb that pressure.
Key price levels for Ethereum
These are the key zones now: The resistance at $2,110 is the next major hurdle, and only a reclaim of this area would put bulls back in the conversation. On the downside, the area around $1,760 acts as support and matches the recent monthly low, which makes it psychologically and technically important. If Ethereum loses this floor, the next relevant orientation point near $1,960 is no longer a cushion above, leaving the chart exposed to deeper downside.
Ethereum indicators: RSI, MACD and volume
The three indicators currently paint a consistent picture, and it is not a friendly one. The RSI at 31 sits right at the edge of oversold territory, which signals stretched conditions but is not yet a reversal trigger on its own. The MACD remains clearly bearish at -67, confirming that downside momentum is still the dominant force, even though the histogram has been narrowing slightly. Volume runs 79% above the 30-day average, which in a declining market typically reflects active selling rather than accumulation. Taken together, the indicators describe a market under real pressure, with any technical bounce attempts still working against the broader trend.
Relative Strength Index
MACD
AI forecast for Ethereum
Looking toward year-end 2026, our AI forecast model places Ethereum in a wide range between $2,208 and $3,641. The central expected value sits at around $2,836, but this should not be read as a price target. It is the midpoint of a broad probability distribution, not a forecast that ETH will trade exactly there.
The range itself matters more than the midpoint, because it reflects how much uncertainty surrounds the current setup. In the conservative case, the model implies upside of about 17.7% from current levels, while the optimistic case points to roughly 94% higher. That spread highlights how much depends on whether the present support zone holds and the broader trend stabilizes.
What could happen now?
Bullish scenario
A constructive turn would require ETH to reclaim the $2,110 resistance on convincing volume, ideally with the MACD histogram continuing to compress toward zero. Above that level, the short-term setup would noticeably improve, and the 30-day downtrend would lose its grip. For the move to look credible, the RSI should not flip straight into overbought territory, and volume should stay supportive rather than fade after the initial push. Just as important: the $1,760 floor must not be retested and broken in the process, otherwise the recovery loses its base.
Trigger: > $2,110 with elevated volume
Bearish scenario
The bearish case is straightforward: the $1,760 support must not break. A daily close below this zone would confirm that buyers were unable to defend the monthly low, and the short-term setup would deteriorate quickly. The next orientation point sits lower, with little technical structure to stop the move once $1,760 gives way. A sustained move below would also keep ETH firmly under both moving averages and put additional pressure on the medium-term trend, which is already running 25% beneath the 200-day line.
Trigger: < $1,760
Conclusion: $1,760 support decides the direction
The technical setup is clearly fragile, but the oversold RSI shows that the market is already stretched on the downside. The decisive area is the $1,760 support zone, which now functions as the line between stabilization and a deeper correction.
If this floor holds and ETH manages to push back toward $2,110, the conversation shifts toward a possible bottoming attempt. If it breaks, the chart opens up further and sellers stay in control, with little structural support directly underneath. The next few trading days are likely to set the direction.
Want to buy Ethereum? Kraken is our recommended crypto trading platform.
Continue to KrakenSince 2017, Philipp Duringer has been deeply involved in Bitcoin, crypto assets and digital financial markets. As the founder of Coinbird, he combines years of crypto experience with more than 15 years of technical experience in IT and digital products. His goal is to make crypto easier to understand, more transparent and easier to compare.
About the authorAI-assisted: This price analysis is generated automatically based on structured market data and reviewed through defined quality rules. It is for informational purposes only and is not financial or investment advice or a recommendation to buy or sell crypto assets.