
Sonic (Fantom) is under heavy pressure and trading right at its weekly low near $0.0209. The MACD remains bearish, RSI has dropped to deeply oversold territory, and volume is well above average as sellers stay in control. If the support at $0.0201 breaks, the next leg lower could accelerate quickly.
Key takeaways in a nutshell
Support under siege: At $0.0209, Sonic is hovering just above the $0.0201 support, with a weekly drop of more than 34%.
Trend clearly broken: Price trades 47% below the 50-day MA and 60% below the 200-day MA, confirming a deeply bearish structure.
$0.0201 decides everything: A clean break below $0.0201 would expose the $0.0165 area as the next downside reference.
Oversold, but not bullish: RSI at 24 signals exhaustion, yet MACD remains bearish and offers no reversal confirmation.
AI sees long road back: The 2026 AI forecast model points to a range of $0.0408 to $0.0821, far above current levels.
What happened to the Sonic (Fantom) price?
Sonic (Fantom) is trading at $0.0209, down more than 11% in 24 hours and roughly 34% over the past seven days. The 30-day picture is even worse, with a loss of around 54%, and price is currently sitting almost exactly at the weekly low of $0.0203.
The most notable signal is volume: 24-hour turnover of nearly $28 million is about 70% above the 30-day average. That kind of activity at the weekly low is rarely a sign of calm accumulation, it points to active distribution and stressed positioning.
Key price levels for Sonic (Fantom)
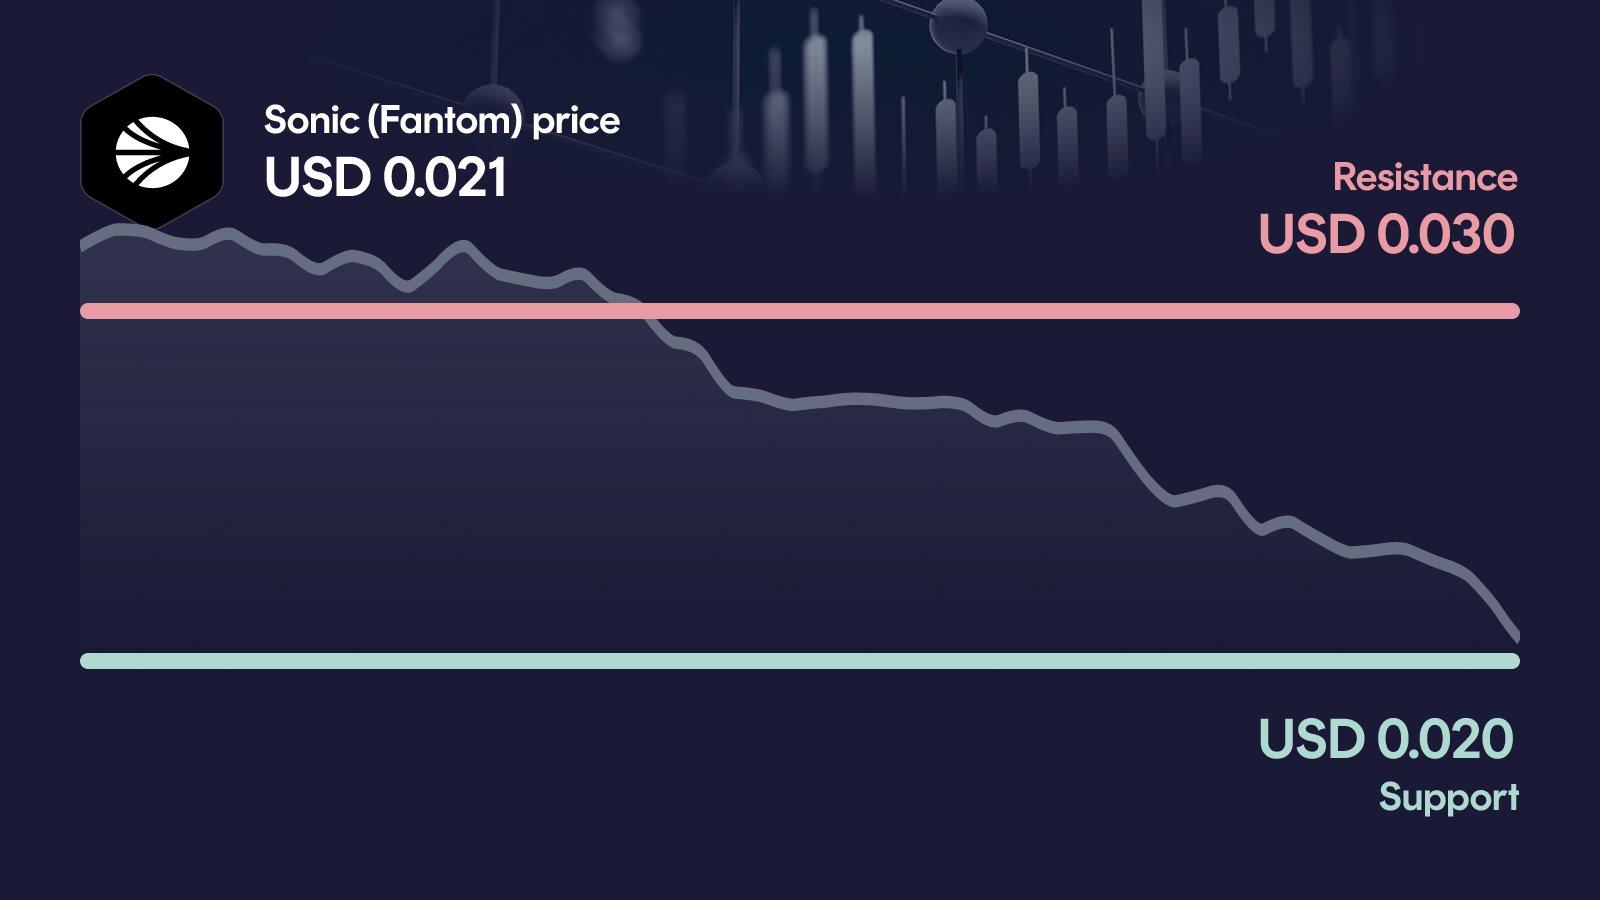
These are the key zones now: The resistance at $0.0304 is the next major hurdle, and only a reclaim of this level would meaningfully ease the selling pressure. On the downside, the area around $0.0201 acts as the decisive support, as it lines up almost exactly with the weekly low. If Sonic (Fantom) falls below it, the next relevant level near $0.0165 moves into focus as the key downside reference.
Sonic (Fantom) indicators: RSI, MACD and volume
The three indicators currently paint a consistent, and clearly bearish, picture. The RSI at 24 is deeply in oversold territory, which signals exhaustion but is not by itself a buy signal in a strong downtrend. The MACD is bearish with a fresh negative crossover, confirming that downside momentum has reaccelerated rather than faded. Volume sitting around 70% above the 30-day average while price prints new lows underlines that sellers, not buyers, are driving this move. Together, the readings suggest that any bounce here would have to fight against a setup where momentum, trend and flow all point the same way.
Relative Strength Index
MACD
AI forecast for Sonic (Fantom)
Looking toward year-end 2026, our AI forecast model places Sonic (Fantom) in a wide range between $0.0408 in the conservative case and $0.0821 in the optimistic case. The central expected value sits near $0.0608, but this is not a price target, it is the midpoint of a broad probability distribution shaped by current weakness and long-term recovery potential.
Given how far Sonic has fallen from its prior highs, the range matters far more than that midpoint. In the conservative scenario, the model still implies an upside of roughly +95% from today's price, while the optimistic case corresponds to about +292%. That spread reflects deep uncertainty: the technical picture is bearish today, yet valuations have already absorbed a heavy drawdown.
What could happen now?
Bullish scenario
A bullish turn would require Sonic to first stabilize clearly above the $0.0201 support and then reclaim the $0.0304 resistance on convincing volume. In that case, the deeply oversold RSI could shift from a stress signal into the fuel for a relief move, provided MACD also flips back toward neutral. For this scenario to remain intact, the $0.0201 area must not be lost again on a daily basis. Only then would the setup transition from pure capitulation toward an early stabilization attempt.
Trigger: > $0.0304 with elevated volume
Bearish scenario
The bearish case is the path of least resistance as long as price trades below the 50- and 200-day moving averages. A clean break below $0.0201 would invalidate the current support and expose the secondary zone around $0.0165 as the next reference. In that scenario, the elevated volume combined with a bearish MACD would likely accelerate the move rather than cushion it. A sustained loss of $0.0165 would put additional pressure on the medium-term trend and push the focus toward the broader downtrend structure.
Trigger: < $0.0201
Conclusion: $0.0201 decides the direction
The technical setup is clearly fragile, but with RSI deeply oversold, a short-term reaction cannot be ruled out. The decisive area is the $0.0201 support, which lines up directly with the weekly low.
If Sonic (Fantom) defends this zone and reclaims $0.0304, the current sell-off could at least pause and shift into a stabilization attempt. If $0.0201 breaks, the door opens toward $0.0165 as the next downside reference and the bearish trend gains further confirmation. The next few trading days are likely to set the direction.
Want to buy Sonic (Fantom)? Kraken is our recommended crypto trading platform.
Continue to KrakenSince 2017, Philipp Duringer has been deeply involved in Bitcoin, crypto assets and digital financial markets. As the founder of Coinbird, he combines years of crypto experience with more than 15 years of technical experience in IT and digital products. His goal is to make crypto easier to understand, more transparent and easier to compare.
About the authorAI-assisted: This price analysis is generated automatically based on structured market data and reviewed through defined quality rules. It is for informational purposes only and is not financial or investment advice or a recommendation to buy or sell crypto assets.