
Ethereum is under pressure and testing the support zone near $1,660 after a 6% weekly loss. Volume is well below average, while the price trades far beneath both the 50- and 200-day moving averages. If this support breaks, the correction could quickly extend toward $1,590 and beyond.
Key takeaways in a nutshell
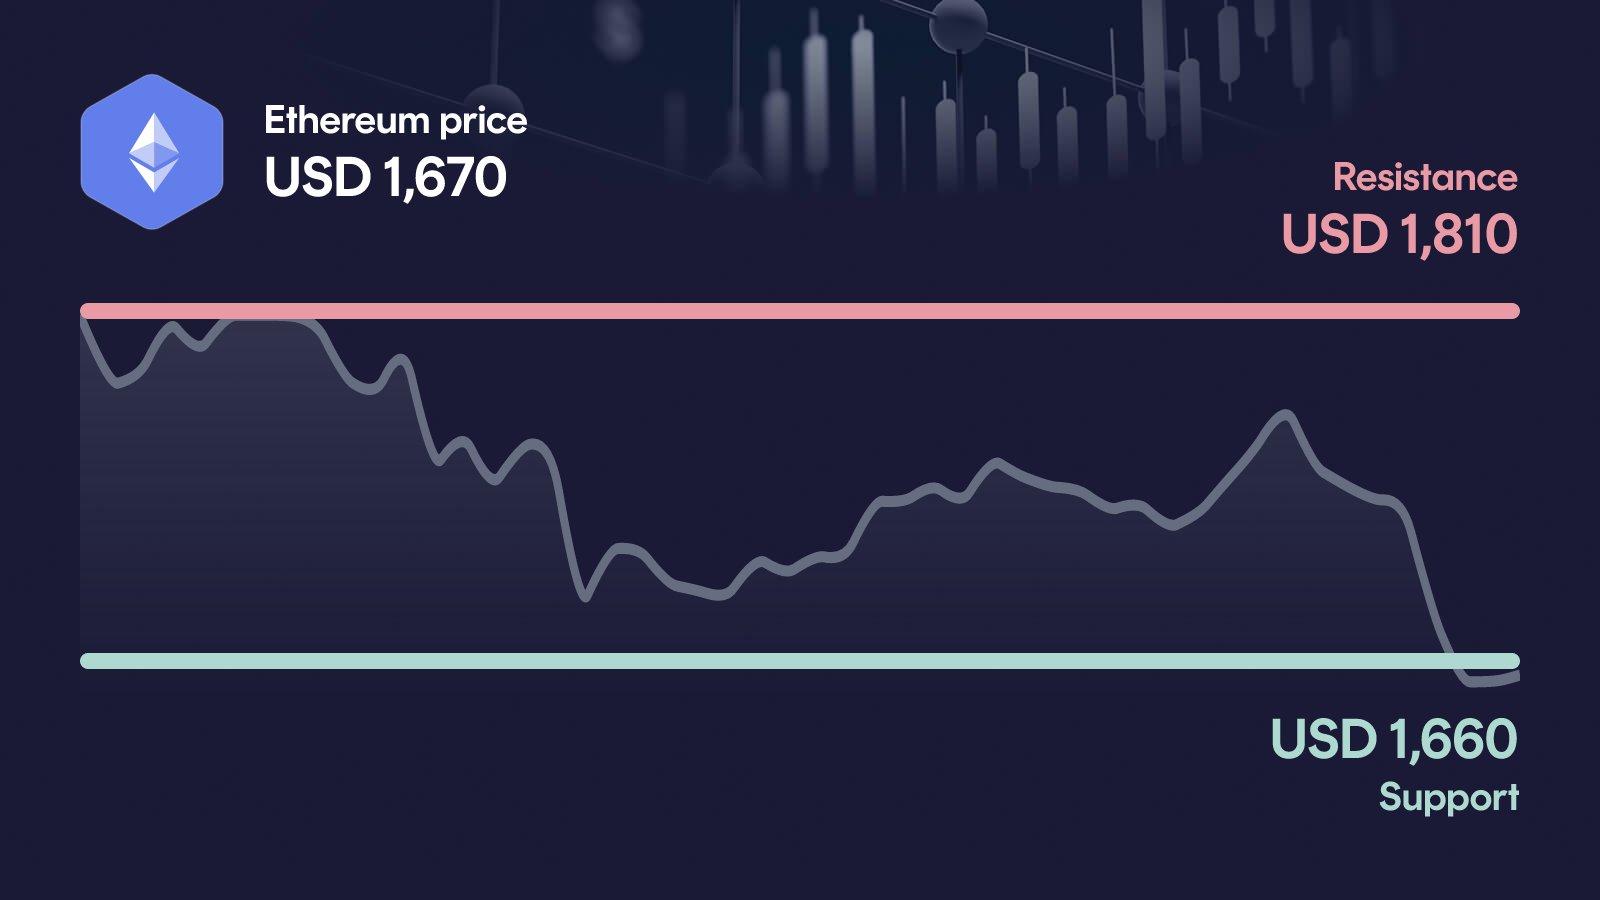
Support under fire: ETH is trading at $1,670, just above the critical $1,660 support after a 6.3% weekly decline.
Trend clearly broken: Price sits 15.7% below the 50-day average and 29.2% below the 200-day average, confirming a weak setup.
Decision zone: The $1,660 support is the line in the sand: a break opens the door to $1,590 and then $1,510.
Momentum fragile: RSI at 42 reflects weakness without being oversold, leaving room for further downside.
AI sees wide range: For year-end 2026, the model spans $1,636 to $2,441, with an average near $2,101.
What happened to the Ethereum price?
Ethereum is currently trading at $1,670, down 6.3% over the past seven days and a steep 20.9% over 30 days. The weekly high near $1,830 already feels distant, while the price now hovers right at the $1,660 support, leaving very little buffer for sellers to test again.
The most notable signal is volume: 24h turnover sits at $8.9 billion, 38% below the 30-day average. That kind of drop in participation during a slide is rarely a sign of strength; it suggests buyers are hesitant rather than actively defending the zone.
Key price levels for Ethereum
These are the key zones now: The resistance at $1,810 is the next major hurdle, and a move above it would be the first real sign that buyers are regaining control. On the downside, the area around $1,660 acts as primary support and is currently being tested directly by price. If Ethereum loses this level, the next relevant reference is $1,590, with $1,510 as the broader downside orientation.
Ethereum indicators: RSI, MACD and volume
The three indicators currently paint a mixed but cautious picture. The RSI at 42 signals weak momentum without being oversold, meaning sellers still have room to push lower before any technical bounce becomes likely. The MACD value of -65.4 remains deep in negative territory, but the histogram has been improving for several sessions, hinting at a fading downside impulse rather than a full reversal. Volume, however, is the weak link: at 38% below the 30-day average, conviction on both sides is missing. Together, the indicators describe a market that is sliding under low participation, with no clear sign yet that buyers are stepping back in.
Relative Strength Index
MACD
AI forecast for Ethereum
Looking toward year-end 2026, our AI forecast model places Ethereum in a wide corridor between $1,636 and $2,441. The central expected value sits near $2,101, but this should not be read as a price target: it is the midpoint of a broad probability distribution, not a destination.
What matters more than the midpoint is the width of the range itself. It reflects how uncertain the path remains as long as ETH trades below its key moving averages. In the conservative case, that implies a possible downside of around 2.2% from current levels, while the optimistic case points to roughly 46% upside. The takeaway is less about precise numbers and more about the asymmetric setup as long as $1,660 holds.
What could happen now?
Bullish scenario
For a constructive shift, Ethereum would first need to defend the $1,660 zone and reclaim ground toward $1,810. A clean break above that resistance, ideally backed by clearly rising volume, would no longer look like a short-term bounce but a real attempt at structural recovery. The RSI would then need to climb without overheating, while the MACD histogram should continue its trend of fading negative pressure. Crucially, the $1,660 level should not be lost again on any pullback, otherwise the setup quickly reverts to weakness.
Trigger: > $1,810 with elevated volume
Bearish scenario
The decisive level on the downside is $1,660. A clear break below it would confirm that the current support is too soft to hold, and short-term sentiment would deteriorate further. The next reference would be $1,590, followed by the broader orientation near $1,510, the 30-day low area. With price already 29% below the 200-day average, losing this support would put additional pressure on the medium-term trend and make any recovery attempts considerably harder.
Trigger: < $1,660
Conclusion: $1,660 level decides the direction
The technical setup is fragile, but not yet broken: ETH is testing its primary support while momentum indicators show early signs of easing downside pressure. The decisive area is the $1,660 zone, with $1,810 as the upside hurdle that would change the tone of the market.
If buyers defend this level and push back above $1,810, the recent slide could be reframed as a deeper pullback within a broader base. If $1,660 breaks, however, the path toward $1,590 and possibly $1,510 opens quickly, especially with volume this thin. The next few trading days are likely to set the direction.
Want to buy Ethereum? Kraken is our recommended crypto trading platform.
Continue to KrakenSince 2017, Philipp Duringer has been deeply involved in Bitcoin, crypto assets and digital financial markets. As the founder of Coinbird, he combines years of crypto experience with more than 15 years of technical experience in IT and digital products. His goal is to make crypto easier to understand, more transparent and easier to compare.
About the authorAI-assisted: This price analysis is generated automatically based on structured market data and reviewed through defined quality rules. It is for informational purposes only and is not financial or investment advice or a recommendation to buy or sell crypto assets.