Cardano is under heavy pressure and approaching the critical support zone near $0.135. The RSI has dropped to deeply oversold territory at 26, while the price trades far below both the 50-day and 200-day moving averages. If support breaks, the next downside reference comes into play quickly.
Key takeaways in a nutshell
ADA under pressure: Cardano trades at $0.1447, down more than 9% on the week and nearly 40% over 30 days.
Trend clearly broken: The price sits 32% below the 50-day average and almost 49% below the 200-day average.
Support must hold: The zone around $0.135 is the last meaningful line before $0.123 comes into focus.
Deeply oversold: RSI at 26 signals exhaustion, but oversold alone is no reversal trigger.
AI sees long road back: For 2026, the model projects a wide range from $0.35 to $0.71, far above current levels.
What happened to the Cardano price?
Cardano is trading at $0.1447, after losing roughly 2.9% in the past 24 hours and 9.1% over the last seven days. Zooming out, the picture gets worse: ADA is down nearly 40% over 30 days and more than 66% over 200 days, with the weekly high at $0.168 already a distant reference.
The most notable signal is volume: 24-hour turnover sits at around $465 million, only marginally below the 30-day average. That means the sell-off is not happening on a panic spike, but in a steady, grinding fashion, which is often more concerning for bulls than a sharp capitulation.
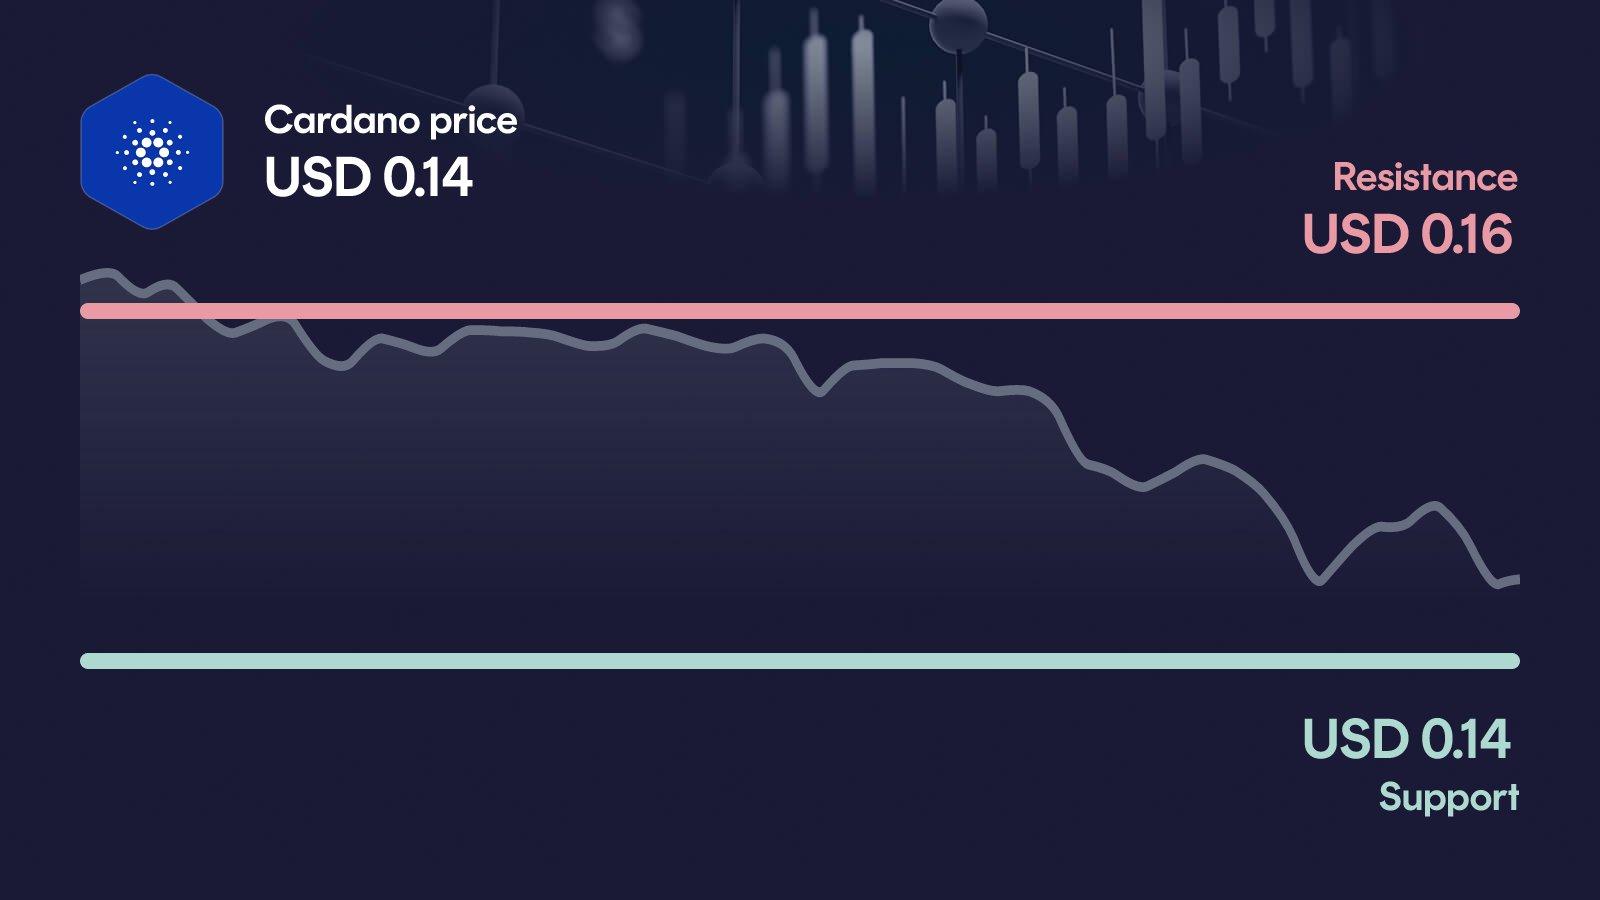
Key price levels for Cardano
These are the key zones now: The resistance at $0.164 marks the first serious hurdle, and only a reclaim of that level would ease the bearish pressure. On the downside, the area around $0.135 acts as primary support, and it is the line that has kept the structure from collapsing further. If Cardano falls below it, the next relevant level near $0.123 becomes the key reference point for the medium-term trend.
Cardano indicators: RSI, MACD and volume
The three indicators currently paint a mixed but cautious picture. The RSI at 26 is deeply in oversold territory, which signals exhaustion in the selling but is not, on its own, a reversal trigger. The MACD remains negative at -0.016, even though the histogram has slowly turned constructive, hinting at a possible easing of downward momentum. Volume sits roughly 6% below the 30-day average, which means there is no fresh buying conviction behind the move. Taken together, the setup looks stretched to the downside, but without a clear demand signal, any bounce attempts remain fragile.
Relative Strength Index
MACD
AI forecast for Cardano
Looking toward year-end 2026, our AI forecast model places Cardano in a wide corridor between $0.35 and $0.71. The central expected value sits near $0.53, but that figure should not be read as a price target. It is the midpoint of a broad probability distribution, and the range itself carries more information than the single number.
The spread reflects how uncertain the medium-term path looks from current levels. In the conservative case, ADA would still need to climb roughly 144% from today's price to reach the lower bound. In the optimistic case, the model implies an upside of around 391% by year-end 2026, which underlines just how deeply ADA is currently discounted relative to its longer-term modeled range.
What could happen now?
Bullish scenario
For a constructive turn, Cardano would need to reclaim the $0.164 resistance on clearly rising volume. That would shift the short-term setup from oversold bounce attempt to a more credible recovery, especially if the MACD continues to improve and the RSI lifts out of extreme oversold territory. Volume would have to confirm the move rather than fade after the first impulse. To keep the scenario intact, the $0.135 area should not be lost again on any pullback.
Trigger: > $0.164 with elevated volume
Bearish scenario
The bearish case is currently the more immediate threat: a daily close below $0.135 would confirm that buyers failed to defend the key support. The next downside reference then sits near $0.123, and from there the structure becomes notably weaker. With price already trading nearly 49% below the 200-day average, a break of support would put further pressure on the medium-term trend. In that scenario, the market would need to show whether demand returns at lower levels or whether the slide simply extends.
Trigger: < $0.135
Conclusion: $0.135 level decides the direction
The technical setup is fragile, but the deeply oversold RSI and the improving MACD histogram suggest that selling pressure is at least losing some steam. The decisive area is the $0.135 support zone, which now acts as the last meaningful line of defense.
If this level holds and Cardano reclaims $0.164, the bounce could turn into a more serious recovery attempt. If $0.135 breaks, the path toward $0.123 opens quickly, and the broader downtrend would gain new fuel. The next few trading days are likely to set the direction.
Want to buy Cardano? Kraken is our recommended crypto trading platform.
Continue to KrakenSince 2017, Philipp Duringer has been deeply involved in Bitcoin, crypto assets and digital financial markets. As the founder of Coinbird, he combines years of crypto experience with more than 15 years of technical experience in IT and digital products. His goal is to make crypto easier to understand, more transparent and easier to compare.
About the authorAI-assisted: This price analysis is generated automatically based on structured market data and reviewed through defined quality rules. It is for informational purposes only and is not financial or investment advice or a recommendation to buy or sell crypto assets.