
Aave is rallying and pushing toward the key resistance area near $101. Momentum is clearly improving, with volume well above average and the MACD turning bullish. If the price clears this zone, the move could gain significantly more traction, but a rejection here would keep the setup fragile.
Key takeaways in a nutshell
Strong weekly move: Aave is trading near $95.79 after a 29% rally over the past seven days.
Trend split: Price sits 19% above the 50-day average but still 18% below the 200-day line at $117.
Breakout in focus: Above $101, the setup would improve significantly and confirm the current strength.
Momentum builds: RSI at 61 and a bullish MACD support the move without showing overheating yet.
AI sees upside room: The 2026 forecast range spans $85.6 to $121.5, with a midpoint near $104.6.
What happened to the Aave price?
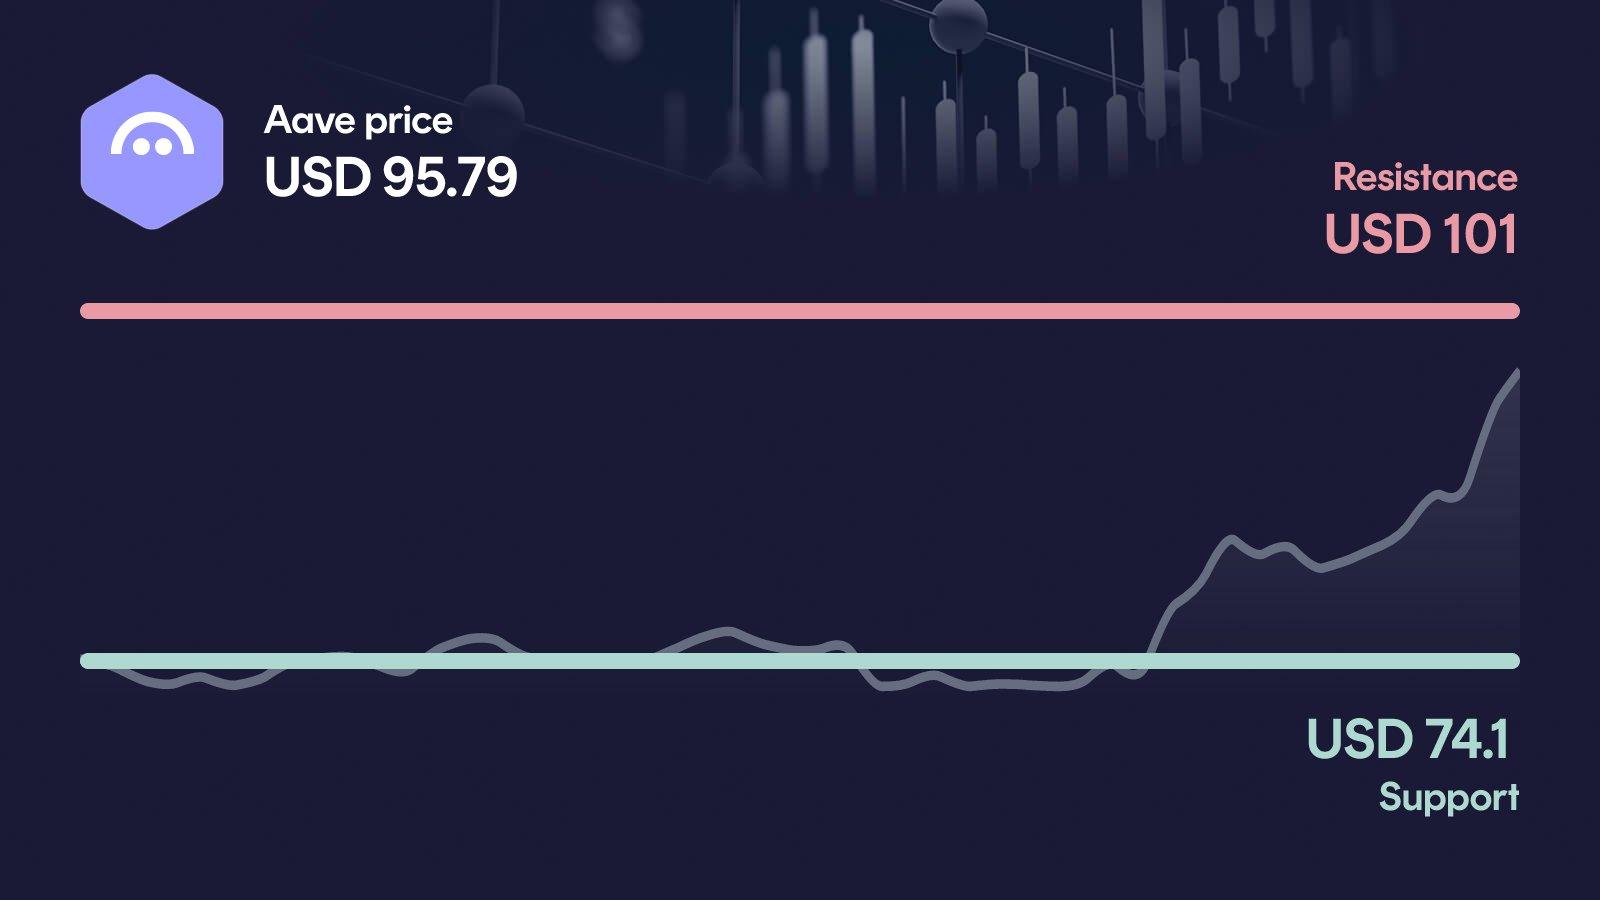
Aave is trading around $95.79, up roughly 12% in the last 24 hours and 29% over the past seven days. On a 30-day basis, the token is up about 18%, with the weekly high at $97.50 sitting just below the next major resistance zone.
The most notable signal is volume: 24-hour turnover of $545 million is running 156% above the 30-day average. That kind of participation underlines the strength of the current move and suggests that the rally is being carried by real flow, not a thin tape.
Key price levels for Aave
These are the key zones now: The resistance at $101 is the next major hurdle, and a clean move above it would confirm the breakout attempt. On the downside, the area around $74.10 acts as primary support, defining where the recent strength would start to lose its base. If Aave falls below it, the next relevant level near $65.70 becomes the key reference point.
Aave indicators: RSI, MACD and volume
The three indicators currently paint a consistent picture. The RSI at 61 signals clear strength without yet reaching overbought territory, leaving room for further upside before momentum gets stretched. The MACD has turned bullish, with a positive histogram trend over the past sessions that confirms the improving momentum. Volume at 156% above the 30-day average shows that buyers are actively driving this move, not just drifting higher on thin flow. Together, the three signals support the constructive setup, as long as price stays above the recent support zone.
Relative Strength Index
MACD
AI forecast for Aave
Looking toward year-end 2026, our AI forecast model places Aave in a range between $85.63 and $121.51. The central expected value sits near $104.58, but this is not a price target. It is the midpoint of a broad probability distribution that explicitly accounts for volatility and uncertainty.
This is why the range matters more than the single midpoint: it shows the realistic band of outcomes the model considers plausible. In the conservative case, that translates into a downside of around 10.3% from current levels, while the optimistic case implies an upside of about 27.2%. The width of that band reflects how much depends on whether the $101 zone is cleared in the coming weeks.
What could happen now?
Bullish scenario
If Aave breaks above $101 on sustained volume, the breakout would no longer look like a short-term impulse but would be much better supported. The short-term setup would clearly improve, with the path opening toward the next orientation levels above. For this to hold, the RSI should not push deep into overbought territory too quickly, and MACD and volume should keep confirming the move. The level that should not be lost again is the $86.70 area, which has acted as the recent stepping stone for the rally.
Trigger: > $101 with elevated volume
Bearish scenario
If Aave loses the $74.10 support, the picture would weaken noticeably. The short-term momentum would fade, and the recent rally would risk being labelled a failed move. The next relevant reference would be the secondary support near $65.70, with the 30-day low around $58.10 as the deeper downside marker. A break of that lower zone would put significantly more pressure on the medium-term trend, especially with price still trading below the 200-day average at $117.
Trigger: < $74.10
Conclusion: Decision at $101
The technical setup is constructive, but the decisive test still lies directly ahead. The crucial area is the $101 resistance, where the current rally has to prove that it is more than a strong rebound.
If Aave clears that zone on continued high volume, the breakout would be confirmed and the upside path would open up further. If the price gets rejected and slips back below $74.10, the move would lose its base and bring the lower support levels back into focus. With RSI, MACD and volume currently aligned, the bulls have the better hand, but nothing is settled yet. The next few trading days are likely to set the direction.
Want to buy Aave? Kraken is our recommended crypto trading platform.
Continue to KrakenSince 2017, Philipp Duringer has been deeply involved in Bitcoin, crypto assets and digital financial markets. As the founder of Coinbird, he combines years of crypto experience with more than 15 years of technical experience in IT and digital products. His goal is to make crypto easier to understand, more transparent and easier to compare.
About the authorAI-assisted: This price analysis is generated automatically based on structured market data and reviewed through defined quality rules. It is for informational purposes only and is not financial or investment advice or a recommendation to buy or sell crypto assets.