
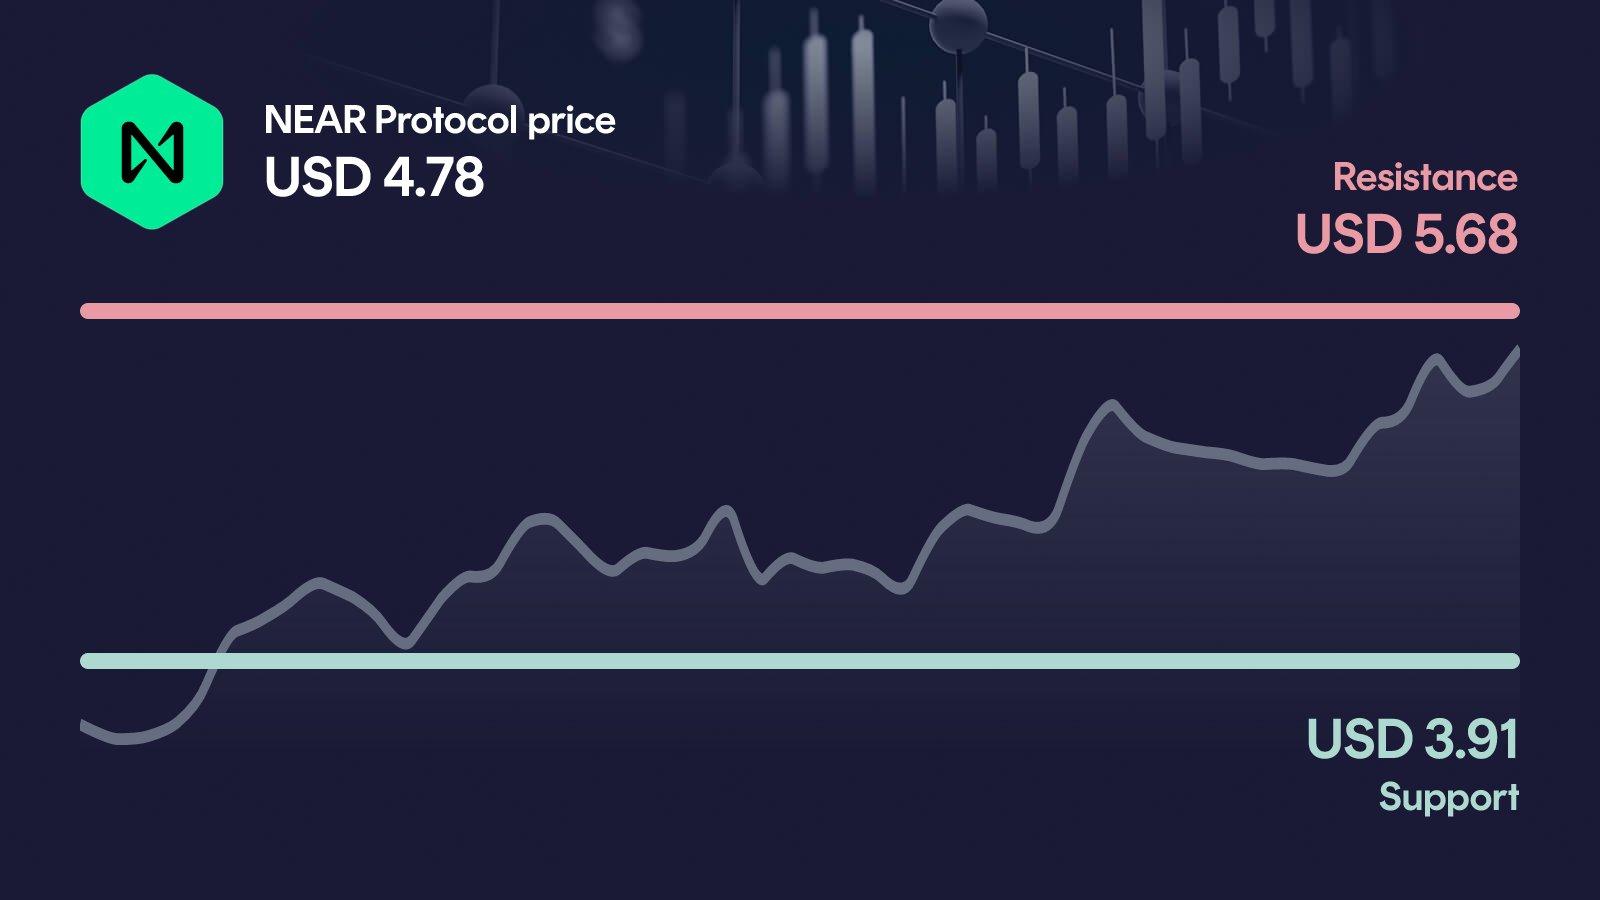
NEAR Protocol comes under sharp pressure: after a strong monthly rally of more than 150%, the price drops 12.6% in 24 hours and now sits at $4.78. With RSI at 85 and volume 77% above its 30-day average, the setup screams overheating. The decisive question now: does the $3.91 support hold, or does NEAR give back a large part of its recent gains?
Key takeaways in a nutshell
Sharp pullback: NEAR trades at $4.78 after a 12.6% drop in 24 hours, cooling off from the weekly high at $5.57.
Trend still intact: Price sits 97% above the 50-day MA at $2.42 and 153% above the 200-day MA at $1.89, keeping the broader uptrend structurally intact.
$3.91 is decisive: The primary support at $3.91 is now the key line. Below it, the next relevant reference is the secondary support at $2.79.
RSI in overheat zone: With RSI at 85, momentum has entered clearly overbought territory, which fits the current sell-off as a technical correction.
AI sees $5.75 to $8.17: The AI forecast model projects a 2026 year-end range of $5.75 to $8.17, roughly 19% to 70% above current levels.
What happened to the NEAR Protocol price?
NEAR Protocol has hit the brakes hard. After tagging a weekly high of $5.57, NEAR dropped 12.6% in 24 hours and now trades at $4.78. Despite the sharp pullback, the 7-day performance still shows a gain of 17.5%, and the 30-day chart is up an impressive 156.7%.
The most telling detail sits in the volume data: 24h turnover of $1.45 billion runs about 77% above the 30-day average. That is not a quiet correction, it is a full-blown reaction after an extended rally, and it puts the primary support at $3.91 directly in focus.
Key price levels for NEAR Protocol
On the upside, the primary resistance stands at $5.68, right above the weekly high; a clean reclaim there would reopen the path toward the secondary resistance at $6.31. On the downside, the primary support at $3.91 is now the critical line, marking the last defense of the current uptrend structure after the sharp 24h drop. If $3.91 fails, the next logically relevant reference is the secondary support at $2.79, which sits well below current levels but aligns with the 50-day moving average zone.
NEAR Protocol indicators: RSI, MACD and volume
The three indicators currently paint a mixed but revealing picture. The RSI at 85 is deep in overbought territory, a classic warning that momentum has run too hot and a pullback like today's was overdue. MACD remains bullish at 0.73 with a still-positive histogram, confirming that the medium-term trend structure has not yet broken. Volume is 77% above the 30-day average, which underlines that today's move is not a low-liquidity blip but a genuine reaction from active market participants. Taken together: the trend is intact, but the overheating signal from RSI explains why $3.91 is now the level that matters.
Relative Strength Index
MACD
AI forecast for NEAR Protocol
Looking toward year-end 2026, our AI forecast model places NEAR Protocol in a range between $5.75 and $8.17. The central expected value sits at $7.03, but this figure should not be read as a price target: it is the midpoint of a broad probability distribution that reflects both upside potential and downside risk.
The width of the range is the key message. In the conservative case, NEAR trades roughly 19.5% above today's price, while the optimistic case implies an upside of about 69.5%. That spread signals real opportunity but also acknowledges that after a 156% rally in 30 days, the market has entered a phase where volatility, not direction, is the dominant variable.
What could happen now?
Bullish scenario
For the bullish case, NEAR would need to defend the $3.91 support and reclaim $5.68 on strong volume. That would neutralize today's pullback and put the secondary resistance at $6.31 in play. Crucially, RSI would need to cool from its current 85 reading before the next push, otherwise any breakout risks becoming a fake-out. MACD and volume should continue supporting the move, and the $3.91 line must not be lost again in the process.
Trigger: > $5.68 with elevated volume
Bearish scenario
The bearish scenario activates if NEAR loses $3.91 on a daily close. That would break the last defense of the current uptrend and open the path toward the secondary support at $2.79. Momentum would flip: the MACD histogram would likely start compressing, and today's already elevated selling volume could accelerate. A sustained move below $2.79 would put the medium-term trend structure itself under serious pressure and force a full reassessment of the 30-day rally.
Trigger: < $3.91
Conclusion: $3.91 level decides the direction
The technical setup is constructive but overheated, with a 156% monthly gain colliding with an RSI at 85 and a 12.6% single-day drop. The decisive area is the primary support at $3.91.
If NEAR defends this zone and reclaims $5.68 on volume, the uptrend narrative stays alive and the AI-projected range toward year-end 2026 remains in reach. If $3.91 breaks, the door opens toward $2.79 and much of the recent rally could unwind. The next few trading days are likely to set the direction.
Want to buy NEAR Protocol? Kraken is our recommended crypto trading platform.
Continue to KrakenSince 2017, Philipp Duringer has been deeply involved in Bitcoin, crypto assets and digital financial markets. As the founder of Coinbird, he combines years of crypto experience with more than 15 years of technical experience in IT and digital products. His goal is to make crypto easier to understand, more transparent and easier to compare.
About the authorAI-assisted: This price analysis is generated automatically based on structured market data and reviewed through defined quality rules. It is for informational purposes only and is not financial or investment advice or a recommendation to buy or sell crypto assets.