
This Chainlink price analysis was published on and is not the latest edition.
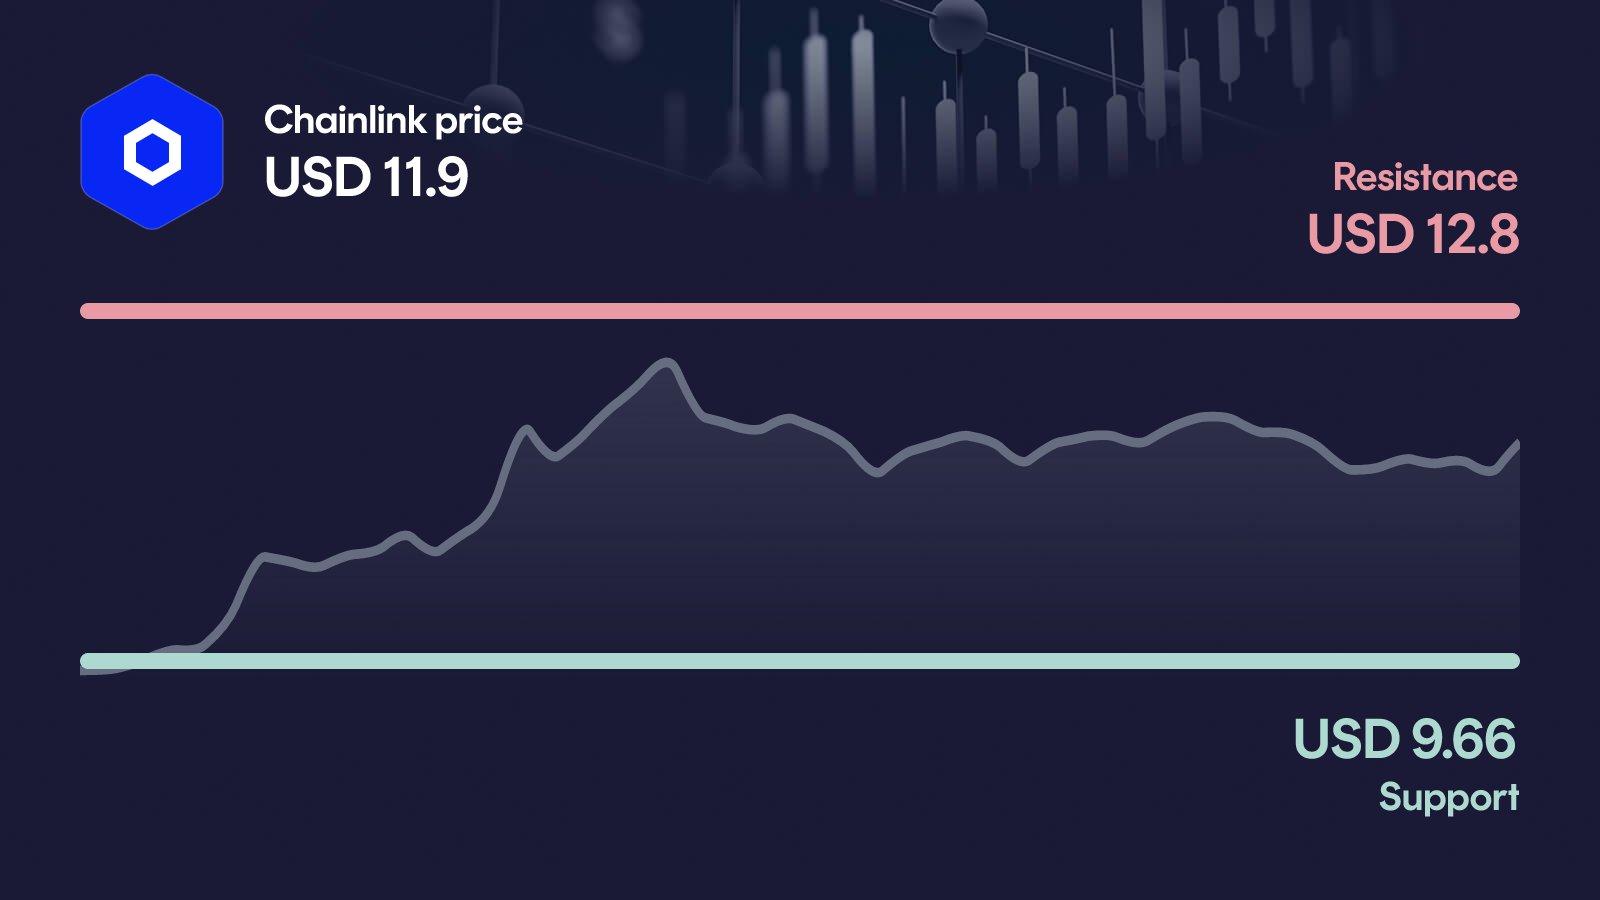
Chainlink is pressing against a major decision zone. After a 12% weekly gain and a 42% surge over 30 days, LINK now trades at $11.90, just below resistance at $12.80. Volume is running well above average, but RSI at 72 signals the rally is entering overheated territory.
Key takeaways in a nutshell
Momentum builds: LINK trades at $11.90 after a 12% weekly gain and a 42% surge over the past 30 days, backed by volume 46% above the 30-day average.
Trend firmly bullish: Price sits 35% above the 50-day average ($8.83) and 32% above the 200-day average ($9.03), a clearly constructive trend structure.
Decision at $12.80: Primary resistance stands at $12.80, with the weekly high at $12.60 acting as the immediate hurdle before a run toward $14.20.
RSI runs hot: With RSI at 72, LINK has entered overbought territory, raising the risk of a short-term pullback even in a strong trend.
AI sees upside: Our AI forecast model projects a year-end 2026 range between $11.59 and $16.44, with an optimistic case of +38%.
What happened to the Chainlink price?
Chainlink is trading at $11.90, up 5.3% in the past 24 hours and 12% over the week. The rally has pushed LINK close to the weekly high at $12.60, marking the strongest zone of the past 30 days. Over that same window, the token has climbed 42%, and the 60-day gain now stands at 64%.
The move is not happening quietly: 24-hour volume of $470 million sits 46% above the 30-day average. That kind of participation is exactly what bulls want to see when a resistance test is approaching, though it also increases the stakes if the level rejects price.
Key price levels for Chainlink
The decisive resistance sits at $12.80, and a clean break above would open the path toward the secondary target at $14.20. On the downside, $9.66 is the primary support and the level that has anchored the recent uptrend, meaning a loss there would seriously weaken the bullish structure. Below that, the next relevant orientation zone is $8.02, with the 30-day low at $7.90 as the deeper reference point.
Chainlink indicators: RSI, MACD and volume
The three indicators currently paint a broadly bullish, but overstretched picture. RSI stands at 72, which places LINK in overbought territory and signals that the rally has already absorbed a lot of buying pressure. MACD is clearly bullish at 0.85, with a histogram that has expanded consistently over the past two weeks, confirming the strength of the underlying momentum. Volume at 46% above the 30-day average shows that this move is not running on air, but on real participation. Taken together, momentum is genuinely strong, yet the elevated RSI warns that a short-term pause or pullback near resistance would not be surprising.
Relative Strength Index
MACD
AI forecast for Chainlink
Looking toward year-end 2026, our AI forecast model places Chainlink in a range between $11.59 and $16.44. The central expected value sits at $14.15, which should not be read as a price target, but as the midpoint of a broad probability distribution.
The width of the range matters more than any single number: it reflects how much the outcome depends on whether LINK can convert the current momentum into a sustained breakout. In the conservative case, price would end roughly 2.5% below current levels, while the optimistic case implies an upside of about 38%. That asymmetry, tilted to the upside, aligns with the constructive trend structure visible in the moving averages.
What could happen now?
Bullish scenario
A daily close above $12.80 with sustained volume would open the door toward the secondary resistance at $14.20. In that case, the short-term setup would shift from a resistance test to a confirmed breakout, and the 50-day average at $8.83 would remain a distant safety net. For the move to stay healthy, RSI should cool off from current overbought readings, while MACD and volume continue to support the trend. Buyers would need to defend $9.66 on any pullback to keep the bullish structure intact.
Trigger: > $12.80 with elevated volume
Bearish scenario
If LINK fails at $12.80 and loses $9.66 on a daily basis, the short-term picture would clearly deteriorate. A rejection at resistance combined with an RSI turning down from 72 would suggest that buyers are exhausted for now. The next relevant reference on the downside would be $8.02, followed by the 30-day low at $7.90. A move into that zone would put the entire 30-day rally under pressure and challenge the constructive trend structure above the 200-day average.
Trigger: < $9.66
Conclusion: Decision at $12.80
The technical setup is constructive, but the market has arrived at a level where a decision is due. The decisive area is the resistance band between $12.60 and $12.80.
A confirmed break above $12.80 would activate the path toward $14.20 and align with the upside skew visible in the AI forecast range. A rejection at resistance combined with a loss of $9.66 would open the door to $8.02 and put the recent 42% rally at risk. With RSI at 72 and volume 46% above average, both scenarios are on the table. The next few trading days are likely to set the direction.
Want to buy Chainlink? Kraken is our recommended crypto trading platform.
Continue to KrakenSince 2017, Philipp Duringer has been deeply involved in Bitcoin, crypto assets and digital financial markets. As the founder of Coinbird, he combines years of crypto experience with more than 15 years of technical experience in IT and digital products. His goal is to make crypto easier to understand, more transparent and easier to compare.
About the authorAI-assisted: This price analysis is generated automatically based on structured market data and reviewed through defined quality rules. It is for informational purposes only and is not financial or investment advice or a recommendation to buy or sell crypto assets.