
This Chainlink price analysis was published on and is not the latest edition.
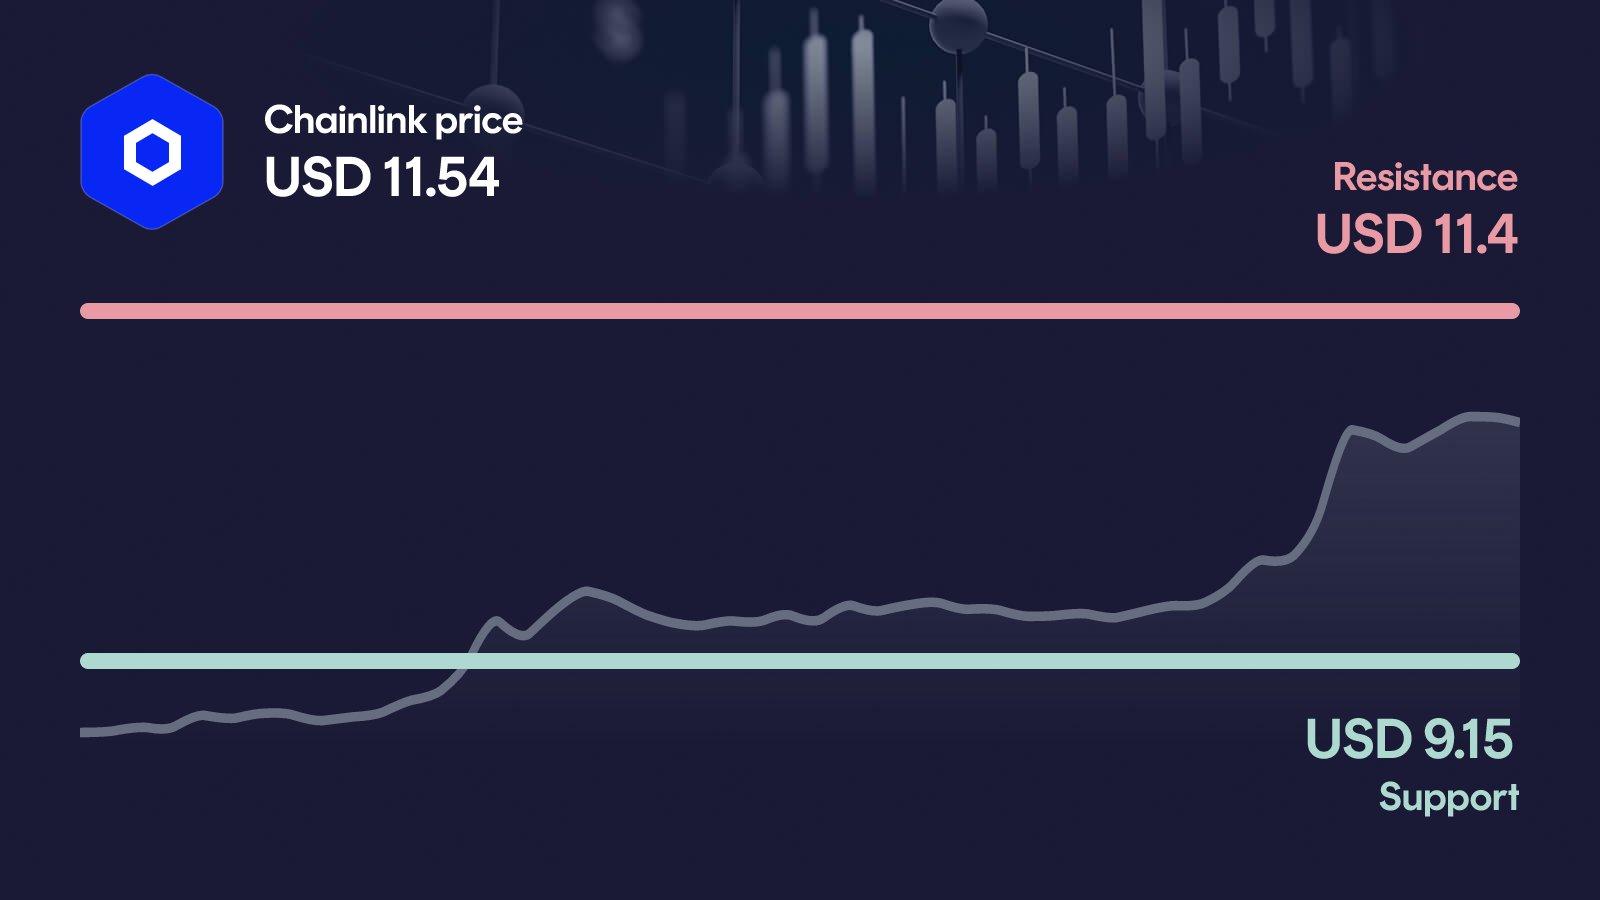
Chainlink is on a tear: LINK trades at $11.54 after a 30% weekly rally, punching through the $11.40 resistance zone on volume more than 300% above its 30-day average. MACD confirms the bullish momentum, but the RSI at 81 is deep in overbought territory. The question now: is this the launchpad for a run at $12.30, or is the rally running out of breath?
Key takeaways in a nutshell
Explosive weekly move: LINK trades at $11.54, up 30% in seven days and 7.2% in the last 24 hours, breaking above the $11.40 resistance.
Trend clearly bullish: Price sits 37.5% above the 50-day average ($8.39) and 28.7% above the 200-day average ($8.97), a textbook uptrend structure.
Decision at $12.30: The next real hurdle is $12.30. A clean push through would open room toward levels not seen for months.
RSI flashing red: With RSI at 81, momentum is stretched. The rally is strong, but overheated conditions raise the risk of a shakeout.
AI sees more upside: Our AI model places the 2026 range between $10.80 and $12.81, with a midpoint at $11.94.
What happened to the Chainlink price?
Chainlink has staged one of its strongest weekly runs of the year. LINK trades at $11.54, up 7.2% in 24 hours and a striking 30% over the last seven days. Over 30 days, the coin is up 32.6%, confirming that this is not just a one-day spike but a broader shift in tone.
The most telling detail sits in the volume column: turnover of $911M is more than 300% above the 30-day average. That level of participation is exactly what bulls want to see when a resistance zone gets tested, and LINK has just pushed above the prior weekly high of $10.90.
Key price levels for Chainlink
The immediate resistance sits at $11.40, which price has just cleared. A daily close above this zone would open the path toward the next hurdle at $12.30. Support comes in at $9.15, and this level matters because it aligns with the recent consolidation base from which the current rally launched. If that support fails, the next relevant orientation to the downside is $7.90.
Chainlink indicators: RSI, MACD and volume
The three indicators currently paint a strongly bullish but overheated picture. The RSI at 81 is deep in overbought territory, signaling that buyers are in full control but also that a cooling phase would be technically healthy. The MACD at 0.41 with a bullish signal and a steadily expanding histogram confirms that momentum is not just present but accelerating. Volume at +301% versus the 30-day average underlines that this move is broad-based, not a thin-air spike. Together, the setup reads as a genuine momentum breakout, with the caveat that stretched RSI readings often precede short-term pullbacks.
Relative Strength Index
MACD
AI forecast for Chainlink
Looking toward year-end 2026, our AI forecast model places Chainlink in a range between $10.80 and $12.81. The central expected value sits at $11.94, which should not be read as a price target but as the midpoint of a broad probability distribution.
The span of the range matters more than the midpoint. In the conservative case, LINK would trade about 6.5% below current levels, while the optimistic case implies roughly 10.8% upside. That skew shows the model sees the current setup as constructive, without pricing in a runaway rally.
What could happen now?
Bullish scenario
A confirmed daily close above $12.30 on continued strong volume would unlock the next leg of this uptrend. The short-term structure would then shift from breakout attempt to trend continuation, with the $11.40 zone flipping into new support. For this to hold, the RSI should cool from its 81 reading without price collapsing, while MACD and volume continue to back the move. As long as $9.15 remains untouched on any pullback, the bullish structure stays intact.
Trigger: > $12.30 with elevated volume
Bearish scenario
A loss of the $9.15 support would put the current breakout narrative in serious doubt. Such a break would suggest the 30% rally was front-loaded and lacked follow-through, especially given the stretched RSI. The next reference level to watch would be $7.90, the recent monthly low. A move into that zone would also drag price back toward the 200-day average at $8.97 and challenge the medium-term trend.
Trigger: < $9.15
Conclusion: Decision at $12.30
The technical setup is clearly constructive, but the overheated RSI adds a note of caution to an otherwise strong picture. The decisive area is the zone between $11.40 and $12.30, where the market will show whether this breakout has real legs.
A clean push above $12.30 on sustained volume would confirm the momentum shift and open room for further upside. A rejection here, followed by a break of $9.15, would instead reframe the move as an exhaustion rally. The next few trading days are likely to set the direction.
Want to buy Chainlink? Kraken is our recommended crypto trading platform.
Continue to KrakenSince 2017, Philipp Duringer has been deeply involved in Bitcoin, crypto assets and digital financial markets. As the founder of Coinbird, he combines years of crypto experience with more than 15 years of technical experience in IT and digital products. His goal is to make crypto easier to understand, more transparent and easier to compare.
About the authorAI-assisted: This price analysis is generated automatically based on structured market data and reviewed through defined quality rules. It is for informational purposes only and is not financial or investment advice or a recommendation to buy or sell crypto assets.