
This Bitcoin Cash price analysis was published on and is not the latest edition.
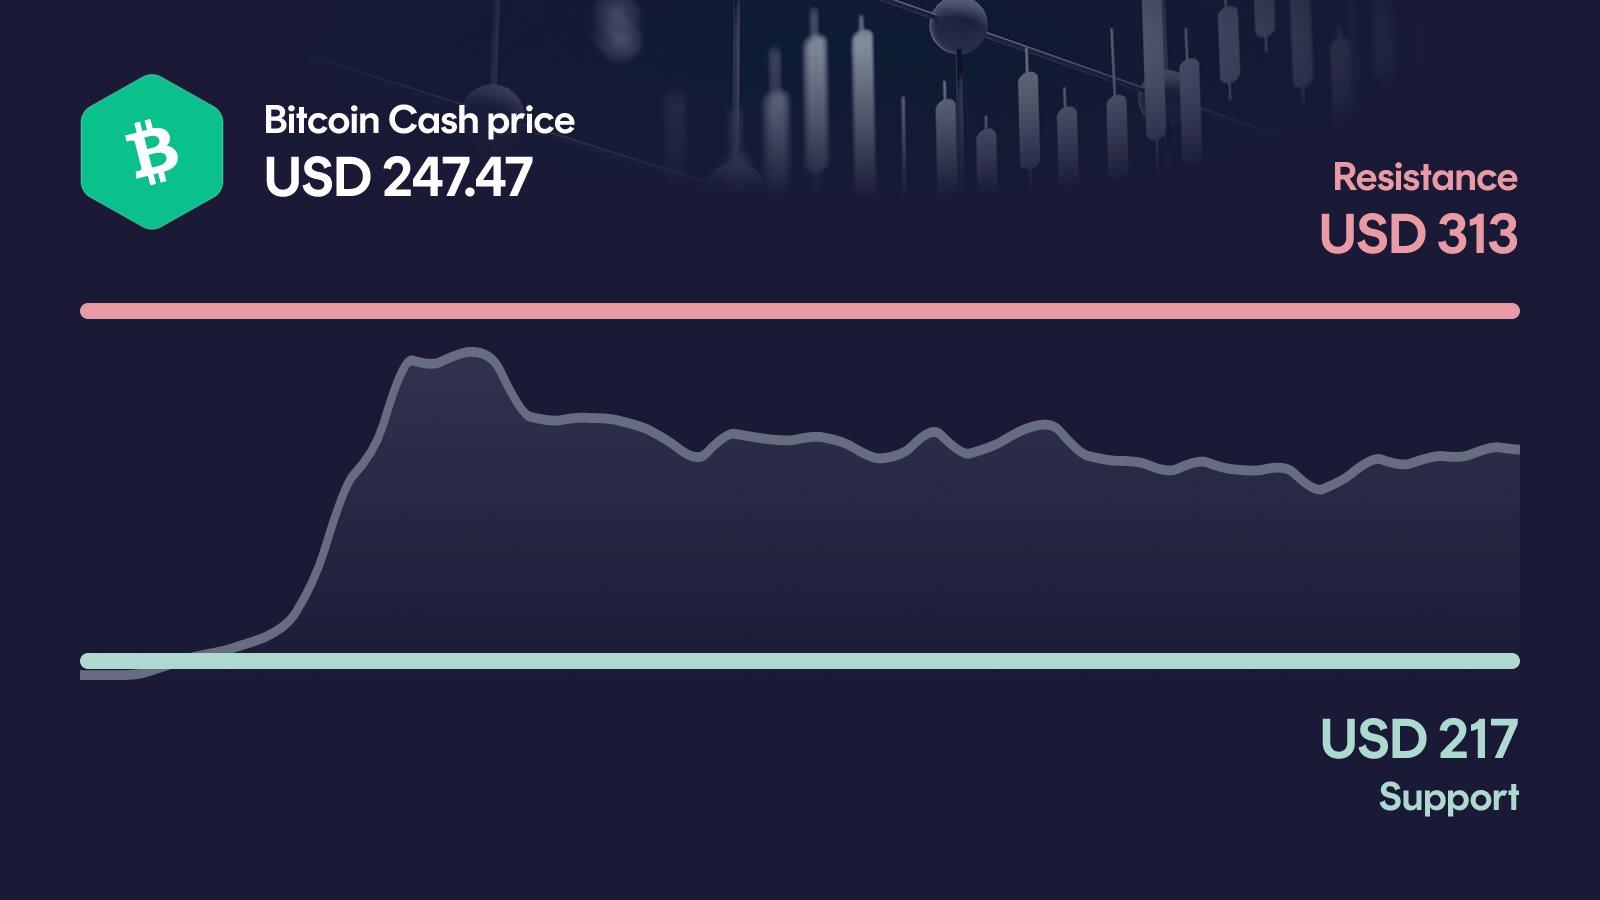
Bitcoin Cash comes under heavy pressure and loses more than 9% in 24 hours, pulling BCH back to $247.47 and directly toward the critical support zone near $217. The 7-day performance now sits at -16.6%, while the 50-day average at $224 quietly turns into the last line of defense before deeper levels come into play. The question is simple: does support hold, or does BCH slide toward the $200 mark?
Key takeaways in a nutshell
Sharp daily drop: Bitcoin Cash falls 9.13% in 24 hours to $247.47, extending a 7-day loss of 16.6%.
Trend still split: BCH trades 10.5% above its 50-day average at $224, but 29.7% below the 200-day at $352.
Support in focus: The $217 support is the key zone; below it, $200 becomes the next reference.
RSI near overbought: With RSI at 69, momentum was stretched heading into this sell-off, leaving little cushion.
AI sees upside range: The AI forecast model projects a year-end 2026 range of $298.87 to $492.75, with a midpoint near $383.75.
What happened to the Bitcoin Cash price?
Bitcoin Cash dropped 9.13% in the last 24 hours and now trades at $247.47. The move drags BCH clearly away from its weekly high of $304 and pulls the price close to the primary support zone near $217. On a 7-day basis, the coin is down 16.6%, while the 30-day performance still shows a gain of 17.6%, highlighting how quickly sentiment has shifted.
What stands out is the volume: 24-hour turnover of roughly $191.7 million sits about 13.6% above the 30-day average, yet still qualifies as average rather than elevated. That means the sell-off carries weight, but it has not yet triggered a full capitulation move.
Key price levels for Bitcoin Cash
On the upside, resistance sits at $313; only a reclaim of this level would seriously reopen the path back toward the recent range high near $304 and the secondary resistance at $356. On the downside, $217 is the decisive support, aligning closely with the 50-day average at $224 and marking the zone that has to hold to keep the short-term structure intact. If that level fails, the next logical reference is $200, the 30-day low and psychological anchor for buyers.
Bitcoin Cash indicators: RSI, MACD and volume
The three indicators currently paint a mixed picture. The RSI stands at 69, just below the overbought threshold, which explains why the sharp drop found little resistance from momentum. The MACD remains bullish with a value of 14.79 and a still-positive histogram, but the latest readings suggest that upside momentum is starting to fade. Volume at 13.6% above the 30-day average is classified as average, meaning the sell-off is noticeable but not driven by panic-level flows. Taken together, the setup shows a market where trend momentum is cooling faster than the MACD alone suggests, and where the $217 zone becomes the real test.
Relative Strength Index
MACD
AI forecast for Bitcoin Cash
Looking toward year-end 2026, our AI forecast model places Bitcoin Cash in a broad range between $298.87 and $492.75. The central expected value sits near $383.75, but this figure is not a price target, rather the midpoint of a wide probability distribution.
The width of this range matters more than any single number, because it reflects how open the medium-term setup still is after the recent drop. In the conservative case, BCH would trade around 20.5% above the current level, while the optimistic case implies an upside of roughly 98.7%. Both ends underline that the forecast leans constructive, but the path there depends heavily on whether current supports hold.
What could happen now?
Bullish scenario
A bullish setup would need BCH to first stabilize above $247 and then reclaim the $304 area on its way back toward $313. In that case, the short-term structure would flip from defensive to constructive, and the 50-day average at $224 would act as a firm floor. For confirmation, the RSI should not push much further into overbought territory, while MACD and volume would need to stay supportive. Crucially, the $217 support must not be lost again once buyers regain control.
Trigger: > $313 with elevated volume
Bearish scenario
The bearish setup activates if BCH loses the $217 support on a sustained basis. Such a break would invalidate the recent recovery attempt, push the price below the 50-day average and open the door toward the next reference at $200. Below that, the secondary support at $165 becomes the medium-term risk zone. In this scenario, the MACD would likely roll over and confirm a shift in momentum, putting the wider trend structure under renewed pressure.
Trigger: < $217
Conclusion: $217 level decides the direction
The technical setup is mixed, but leaning fragile after the 9% daily drop and the fading momentum in the histogram. The decisive area is the $217 support zone, which coincides with the 50-day average and marks the line between an intact short-term structure and a deeper correction.
A reclaim of $304 and a push toward $313 would clearly shift the picture back in favor of the bulls. A clean break below $217, on the other hand, would expose $200 as the next stop and put the medium-term trend under additional pressure. With RSI still near 69 and volume only average, neither side has fully taken control. The next few trading days are likely to set the direction.
Want to buy Bitcoin Cash? Kraken is our recommended crypto trading platform.
Continue to KrakenSince 2017, Philipp Duringer has been deeply involved in Bitcoin, crypto assets and digital financial markets. As the founder of Coinbird, he combines years of crypto experience with more than 15 years of technical experience in IT and digital products. His goal is to make crypto easier to understand, more transparent and easier to compare.
About the authorAI-assisted: This price analysis is generated automatically based on structured market data and reviewed through defined quality rules. It is for informational purposes only and is not financial or investment advice or a recommendation to buy or sell crypto assets.