
This Bitcoin Cash price analysis was published on and is not the latest edition.
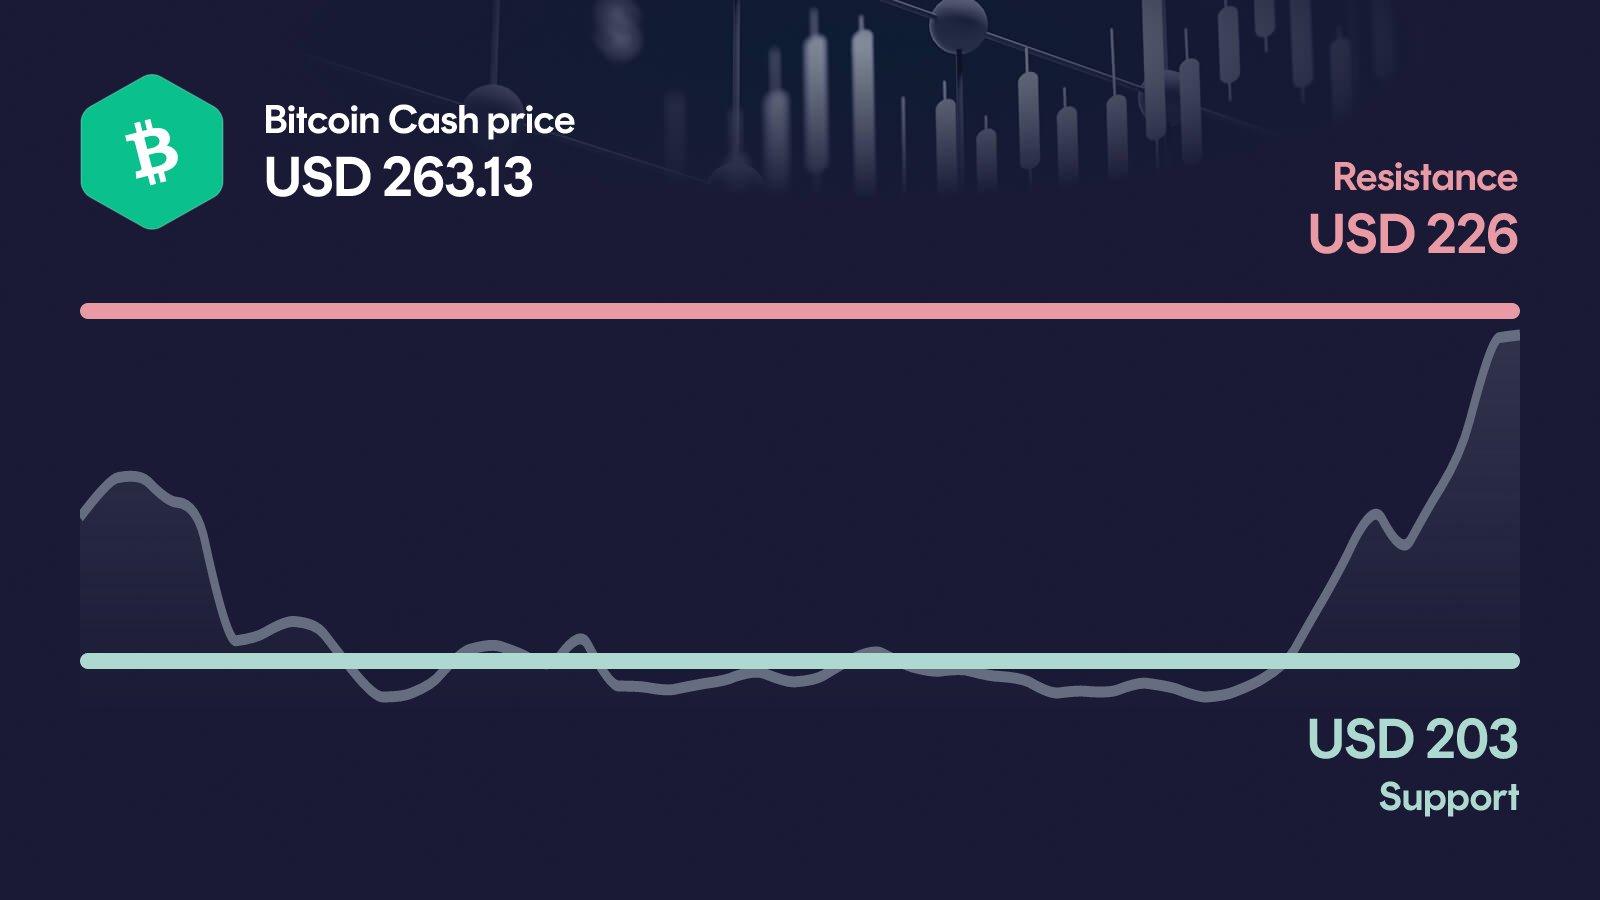
Bitcoin Cash is exploding higher, jumping nearly 22% in a single day and pushing well above the $226 resistance zone that capped price for weeks. Volume has surged to more than four times its 30-day average, giving the move a rare quality of conviction. Now the question is whether BCH can hold this level and target $235, or whether the breakout fades back into the old range.
Key takeaways in a nutshell
Explosive daily move: BCH trades at $263.13 after a 21.9% surge, breaking cleanly above the $226 resistance zone.
Trend split: Price sits 20% above the 50-day average at $219, but still 27% below the 200-day at $361.
Decision zone: The $226–$235 area is now the critical band that decides whether the breakout holds.
Momentum intact: RSI at 52 leaves ample room higher, while MACD has flipped to a fresh bullish crossover.
AI outlook 2026: Our AI model sees a year-end range of $221 to $330, with a central value near $270.
What happened to the Bitcoin Cash price?
Bitcoin Cash has staged one of its strongest daily moves in months, climbing 21.9% to $263.13. The rally lifts BCH clearly above the $226 resistance that had capped price action throughout the past weeks and turns the 7-day performance to +28.2%.
What makes this move stand out is the volume behind it: 24-hour turnover of $534 million is roughly 353% above the 30-day average. That is not a quiet drift higher — it is a decisive push, backed by real participation, and it takes BCH well beyond the recent monthly high of $227.
Key price levels for Bitcoin Cash
The first resistance sits at $226, which price has just cleared; the next meaningful hurdle is $235, and a sustained move above it would open the path toward the wider trend zone near the 200-day average. Support now comes in at $203, a level that defined the base of the recent range and would need to hold on any pullback to confirm the breakout structure. Below that, $194 acts as the next reference, and a break there would put the entire recovery narrative back in question.
Bitcoin Cash indicators: RSI, MACD and volume
The three indicators currently paint a consistent picture. RSI at 52 is neutral to slightly constructive, leaving plenty of headroom before overbought conditions kick in. MACD has just flipped to a bullish crossover, with the histogram turning positive again after several negative sessions, confirming that momentum is shifting. Volume is the loudest signal here: at 353% above the 30-day average, it shows the breakout is being driven by real flow, not thin liquidity. Taken together, the setup suggests the move has technical substance rather than being a one-off spike.
Relative Strength Index
MACD
AI forecast for Bitcoin Cash
Looking toward year-end 2026, our AI forecast model places Bitcoin Cash in a range between $221.41 on the conservative side and $330.30 on the optimistic end. The central expected value sits at $270.43, which is not a price target, but the midpoint of a broad probability distribution.
The width of that range matters: it reflects both the strength of the current breakout and the still-heavy overhang from the 200-day average at $361. In the conservative case, BCH would trade about 16.1% below current levels, while the optimistic case implies roughly 25.1% upside from here. That spread underlines how much depends on whether the current momentum can carry price into the wider trend zone or fades back into the recent range.
What could happen now?
Bullish scenario
If BCH manages to clear $235 on continued strong volume, the breakout gains a second confirmation and the technical setup shifts meaningfully. RSI at 52 still has room before overheating, which would give the move space to extend without immediate exhaustion signals. Ideally, MACD stays in bullish territory and volume remains well above average to validate the flow behind the push. The key hold condition: $226 should not be lost again on a daily basis, otherwise the breakout risks turning into a failed test.
Trigger: > $235 with elevated volume
Bearish scenario
The bearish setup activates if BCH slides back below $203, the primary support that anchored the recent base. A break there would invalidate the current breakout structure and quickly bring $194 into play as the next reference. In that case, MACD would likely roll back into negative territory and the volume spike would look more like a blow-off than the start of a trend. A sustained move below $194 would put additional pressure on the medium-term picture and reopen the gap toward the monthly low near $200.
Trigger: < $203
Conclusion: Decision at $235
The technical setup is constructive, but the real test still lies ahead at the $235 level. The decisive area is the $226–$235 band, where the market decides whether this surge is the start of a broader recovery or a strong but isolated spike.
On a clean break above $235 with sustained volume, BCH gains room toward the wider trend zone and the bullish narrative strengthens materially. On a slide back below $203, the breakout would be neutralized and $194 quickly comes into focus. With RSI still neutral, MACD flipping bullish and volume more than four times the 30-day average, the ingredients for continuation are there. The next few trading days are likely to set the direction.
Want to buy Bitcoin Cash? Kraken is our recommended crypto trading platform.
Continue to KrakenSince 2017, Philipp Duringer has been deeply involved in Bitcoin, crypto assets and digital financial markets. As the founder of Coinbird, he combines years of crypto experience with more than 15 years of technical experience in IT and digital products. His goal is to make crypto easier to understand, more transparent and easier to compare.
About the authorAI-assisted: This price analysis is generated automatically based on structured market data and reviewed through defined quality rules. It is for informational purposes only and is not financial or investment advice or a recommendation to buy or sell crypto assets.