
This VeChain price analysis was published on and is not the latest edition.
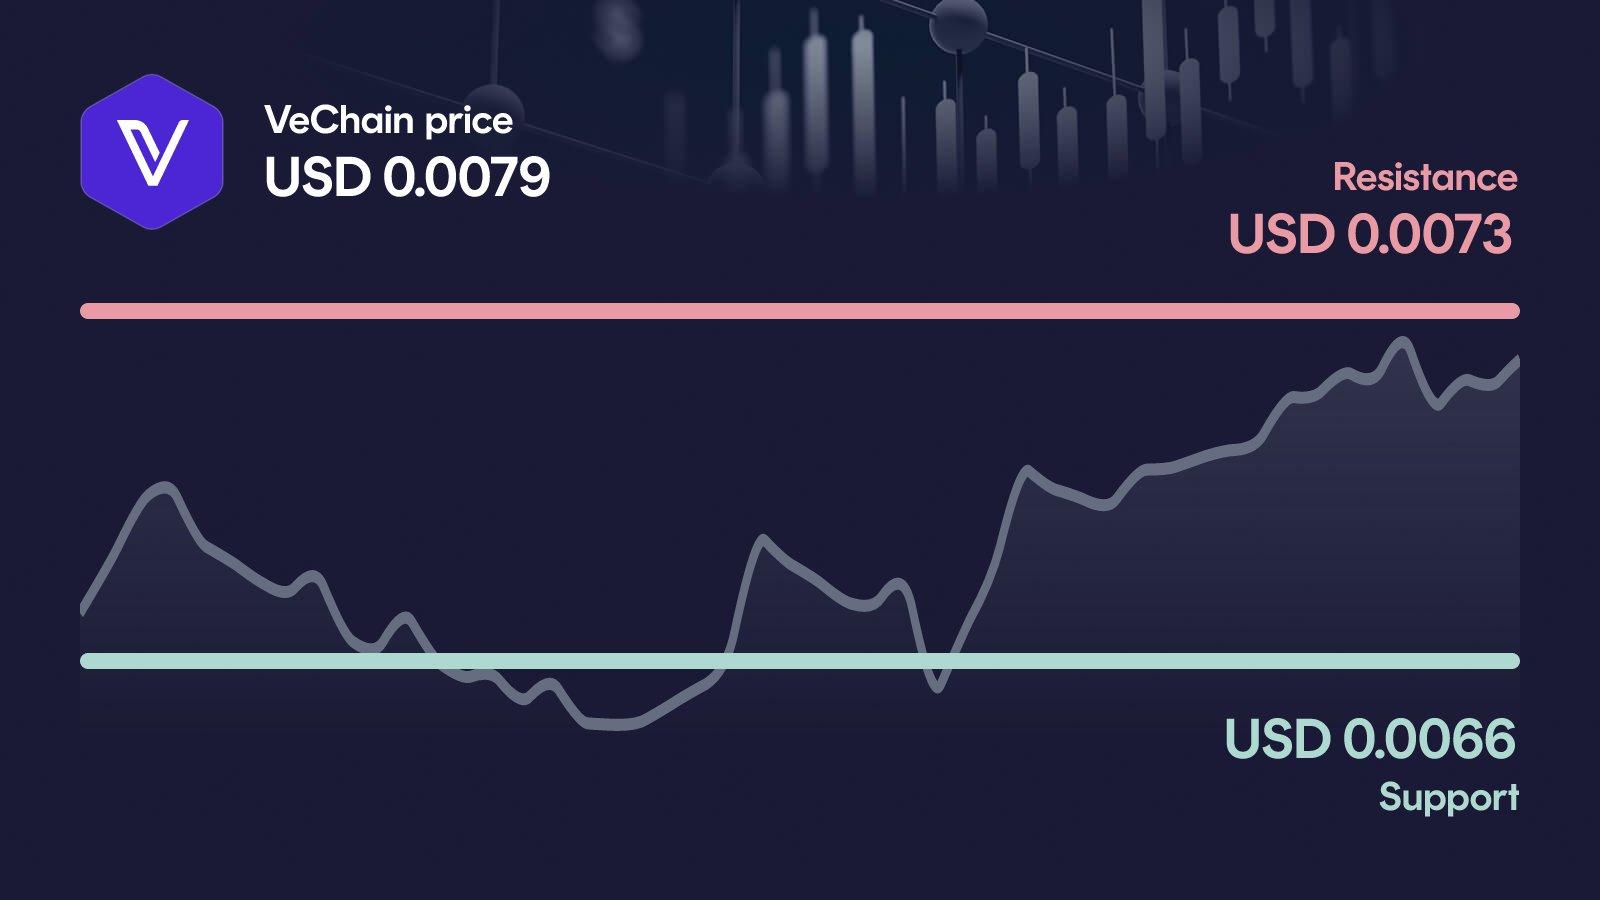
VeChain is exploding higher, up 11% in 24 hours and 65% over the past month. The rally has pushed VET clean through the $0.00733 resistance, backed by volume 73% above the 30-day average and a bullish MACD. But with the RSI already at 72, the question is whether this breakout has room to run or is running on fumes.
Key takeaways in a nutshell
Explosive 24h move: VET trades at $0.00788, up 11.1% in a day and 65% over the last 30 days, breaking above the primary resistance at $0.00733.
Trend clearly bullish: Price sits 49% above the 50-day average ($0.00529) and 20.7% above the 200-day average ($0.00653), confirming a strong uptrend.
Decision zone above: The next resistance sits at $0.00758, with the monthly high at $0.0076 as the key orientation point on the upside.
RSI runs hot: The RSI has climbed to 72, entering overbought territory and signalling that the rally could need a breather.
AI sees more upside: Our AI model projects a 2026 range from $0.00674 to $0.01111, with an optimistic case implying nearly 40% additional upside.
What happened to the VeChain price?
VeChain has broken out. VET trades at $0.00788, up 11.1% in the past 24 hours and 18% over the week, pushing decisively above the primary resistance at $0.00733 that had capped previous attempts.
The move is not happening in isolation: over the last 30 days, VET has gained 65%, and the 24-hour trading volume of $18.1 million sits 73% above the 30-day average. That kind of volume expansion during a breakout is exactly what bulls want to see, and it separates this move from the low-conviction bounces earlier in the year.
Key price levels for VeChain
The primary resistance at $0.00733 has just been cleared, and the next hurdle now sits at $0.00758, which aligns closely with the monthly high at $0.0076. On the downside, the primary support at $0.00664 is the level bulls need to defend to keep the breakout structure intact, as it marks the last consolidation zone before the surge. Should that fail, the secondary support at $0.0062 becomes the next relevant reference before the setup would need a full rethink.
VeChain indicators: RSI, MACD and volume
The three indicators currently paint a strongly bullish, but slightly overheated picture. The RSI has climbed to 72, which is technically in overbought territory and warns that short-term exhaustion is possible. The MACD sits at 0.00053 with a clearly bullish signal, confirming that momentum on the trend side is still intact. Volume at 73% above the 30-day average underlines that this breakout has real participation, not just algorithmic wicks. Taken together, the setup is bullish with conviction, but the elevated RSI means a short pause or shakeout would not be surprising before the next leg.
Relative Strength Index
MACD
AI forecast for VeChain
Looking toward year-end 2026, our AI forecast model places VeChain in a range from $0.00674 to $0.01111. The central expected value sits at $0.00910, but this figure should not be read as a price target, rather as the midpoint of a broad probability distribution.
The width of the range is the more important signal: it reflects how much uncertainty still surrounds VET despite the strong 30-day rally. In the conservative case, the model implies a downside of around 15.3% from current levels, while the optimistic case suggests roughly 39.7% additional upside. That spread underlines that the breakout has opened up meaningful room in both directions.
What could happen now?
Bullish scenario
A clean daily close above $0.00758 would confirm the breakout and open the path toward the $0.0076 monthly high and beyond. For this to hold, the RSI should ideally cool from 72 into the mid-60s without a full reversal, while the MACD and above-average volume need to keep supporting the move. The 20.7% cushion above the 200-day average gives the trend room to breathe, but $0.00664 must not be lost again, as it would signal the breakout was premature.
Trigger: > $0.00758 with elevated volume
Bearish scenario
If VET slips back below $0.00664, the breakout narrative loses its foundation and the recent surge starts to look like a blow-off move. The overbought RSI would then act as a headwind rather than a tailwind, and MACD momentum could roll over quickly. The next reference on the downside would be the secondary support at $0.0062, and a break there would put the entire rally structure back in question, with the 200-day average at $0.00653 as the medium-term line that bulls cannot afford to lose.
Trigger: < $0.00664
Conclusion: Decision at $0.00758
The technical setup is constructive, but the elevated RSI at 72 introduces a note of caution. The decisive area sits between $0.00733, which has just flipped from resistance, and the next hurdle at $0.00758.
If VET clears $0.00758 with volume intact, the door opens toward the monthly high and confirms this as a genuine trend continuation. If instead the price falls back under $0.00664, the breakout risks being invalidated and the focus shifts quickly to $0.0062. The next few trading days are likely to set the direction.
Want to buy VeChain? Kraken is our recommended crypto trading platform.
Continue to KrakenSince 2017, Philipp Duringer has been deeply involved in Bitcoin, crypto assets and digital financial markets. As the founder of Coinbird, he combines years of crypto experience with more than 15 years of technical experience in IT and digital products. His goal is to make crypto easier to understand, more transparent and easier to compare.
About the authorAI-assisted: This price analysis is generated automatically based on structured market data and reviewed through defined quality rules. It is for informational purposes only and is not financial or investment advice or a recommendation to buy or sell crypto assets.