
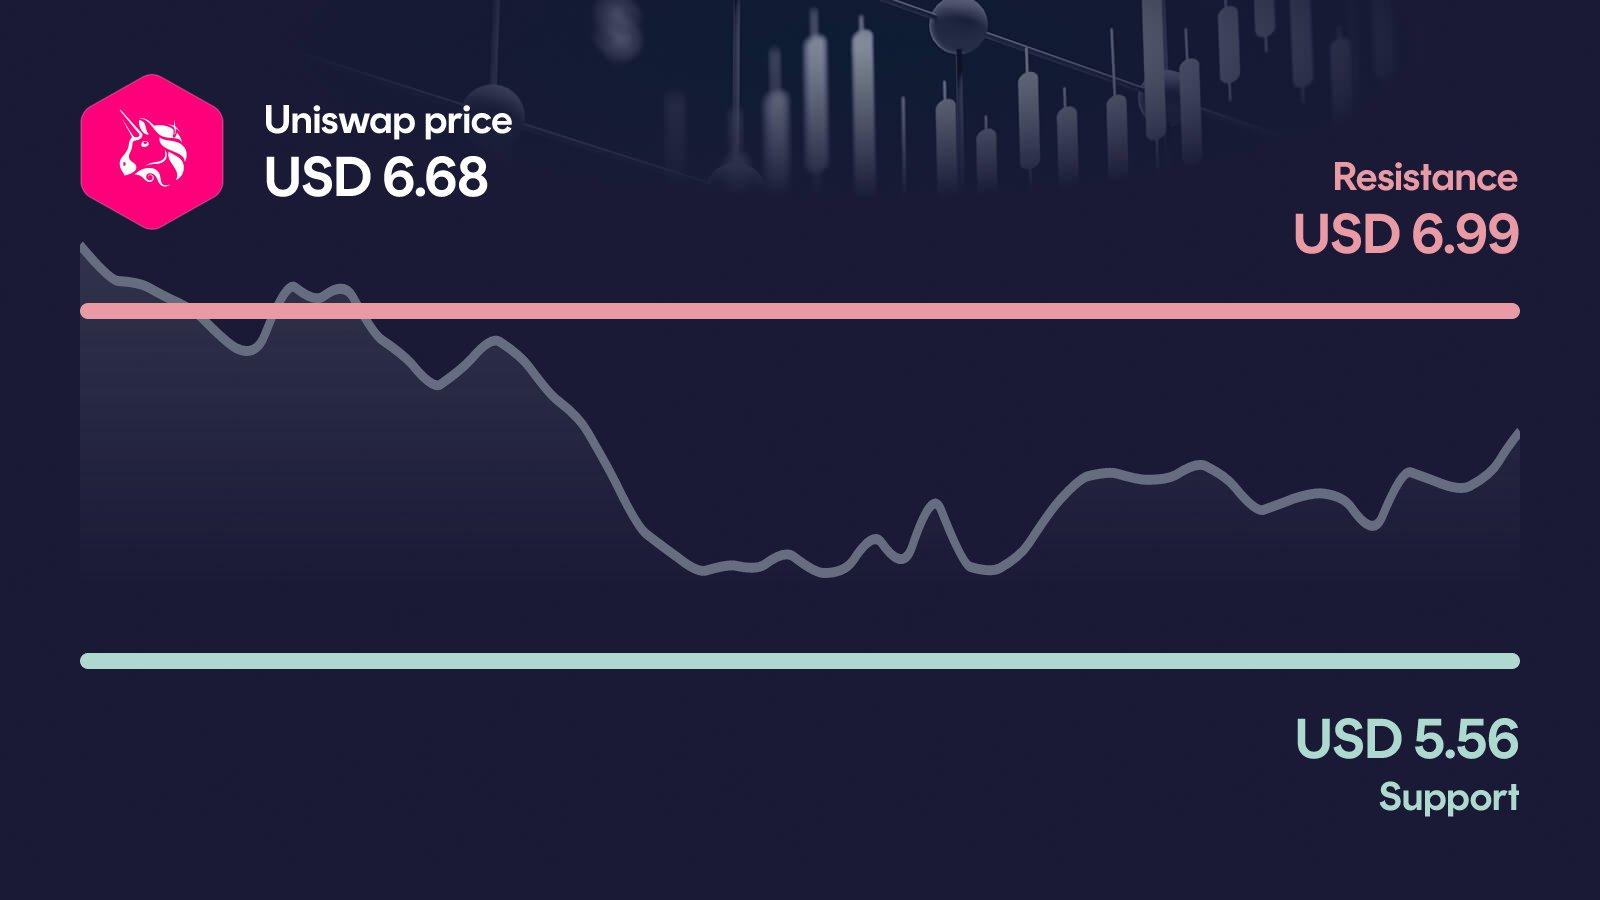
Uniswap is back on the offensive: UNI climbs more than 7% in a day and pushes toward the key $6.99 resistance. The 30-day chart is up over 100%, but the MACD has just flipped bearish, warning that momentum is fragile. Now it gets interesting: a clean break above $6.99 opens the door higher, while a slip below $5.56 would put the entire rally in question.
Key takeaways in a nutshell
Sharp intraday rebound: UNI trades at $6.676 after a 7% daily jump, recovering from the weekly low near $5.86 and setting up a direct test of $6.99 resistance.
Trend clearly bullish: Price sits 44% above the 50-day average ($4.63) and 81% above the 200-day average ($3.69), a textbook bullish trend structure.
$6.99 is the line: The $6.99 zone is the immediate decision level. A daily close above it opens the path toward $7.48; a rejection sends UNI back to $5.56.
Momentum still cooling: RSI at 59 leaves room upward, but the MACD histogram just turned negative, hinting the underlying momentum is losing steam despite the price bounce.
AI sees upside skew: Our AI model projects a year-end 2026 range of $6.36 to $8.58, with a midpoint of $7.77, roughly 15% above spot.
What happened to the Uniswap price?
Uniswap is back in attack mode. UNI trades at $6.676 after a 7% daily gain, pushing straight toward the $6.99 resistance that has capped the recent range. The bounce came directly off the weekly low near $5.86, turning a soft week into a decisive test of the upper edge.
The bigger picture makes the move stand out: UNI is up more than 106% over 30 days and nearly 90% over 60 days, even though the past seven days show a mild 6% pullback. Volume at $551 million sits only about 5% above the 30-day average, which is not the explosive turnover a clean breakout would usually require.
Key price levels for Uniswap
The first hurdle sits at $6.99; a daily close above it would open the way toward the monthly high at $7.48 and then the secondary resistance at $7.86. On the downside, $5.56 is the primary support, and it matters because it separates the current uptrend from a deeper correction toward the secondary support at $4.99. If both give way, the next relevant orientation is the monthly low near $3.20, which would completely reset the recent rally.
Uniswap indicators: RSI, MACD and volume
The three indicators currently paint a mixed picture. RSI at 59 sits in the upper neutral zone: enough room to continue higher, but no longer a fresh momentum push. The MACD prints a bearish signal with a histogram that just flipped negative, which weakens the case for an immediate breakout. Volume at roughly 5% above the 30-day average is best described as average, not the surge one would expect on a strong resistance test. Taken together, price is knocking on the door, but the underlying momentum is not yet delivering the confirmation bulls need.
Relative Strength Index
MACD
AI forecast for Uniswap
Looking toward year-end 2026, our AI forecast model places UNI in a range between $6.36 and $8.58. The central expected value sits at $7.77, which is not a price target, but the midpoint of a broad probability distribution. In other words, it marks the area where the model sees the highest concentration of possible outcomes, not a promised destination.
The width of the range is the more important message: it acknowledges that UNI can either digest its recent 100%+ rally or extend it further. In the conservative case, UNI would trade about 5.5% below the current price, while the optimistic case implies roughly 27.5% upside. That skew leans slightly bullish, but the downside risk is clearly kept on the table.
What could happen now?
Bullish scenario
The bullish case activates on a daily close above $6.99 with visibly stronger volume than today's average print. Such a move would confirm the rebound from $5.86 and open the path toward the monthly high at $7.48, with $7.86 as the next reference. For the setup to hold, RSI should push higher without overheating above 70, and the MACD histogram would need to turn back up to validate the breakout. As long as UNI defends $6.99 as new support afterwards, the broader uptrend remains intact.
Trigger: > $6.99 with elevated volume
Bearish scenario
The bearish case triggers if UNI loses $5.56 on a daily close. That would confirm the fresh MACD bearish signal and turn the recent rejection at $6.99 into a lower high. The next reference on the downside is the secondary support at $4.99, and below that the picture opens toward the monthly low near $3.20. A slide back under the 50-day average at $4.63 would put serious pressure on the medium-term trend that has driven the 100%+ monthly gain.
Trigger: < $5.56
Conclusion: Decision at $6.99
The technical setup is constructive, but the fresh bearish MACD signal and only average volume warn against reading today's 7% jump as a done deal. The decisive area is the band between $6.99 resistance and $5.56 support.
A clean breakout above $6.99 with real volume would open the door toward $7.48 and keep the strong 30-day trend alive. A break below $5.56, on the other hand, would expose $4.99 and put the entire rally structure at risk. The next few trading days are likely to set the direction.
Want to buy Uniswap? Kraken is our recommended crypto trading platform.
Continue to KrakenSince 2017, Philipp Duringer has been deeply involved in Bitcoin, crypto assets and digital financial markets. As the founder of Coinbird, he combines years of crypto experience with more than 15 years of technical experience in IT and digital products. His goal is to make crypto easier to understand, more transparent and easier to compare.
About the authorAI-assisted: This price analysis is generated automatically based on structured market data and reviewed through defined quality rules. It is for informational purposes only and is not financial or investment advice or a recommendation to buy or sell crypto assets.