
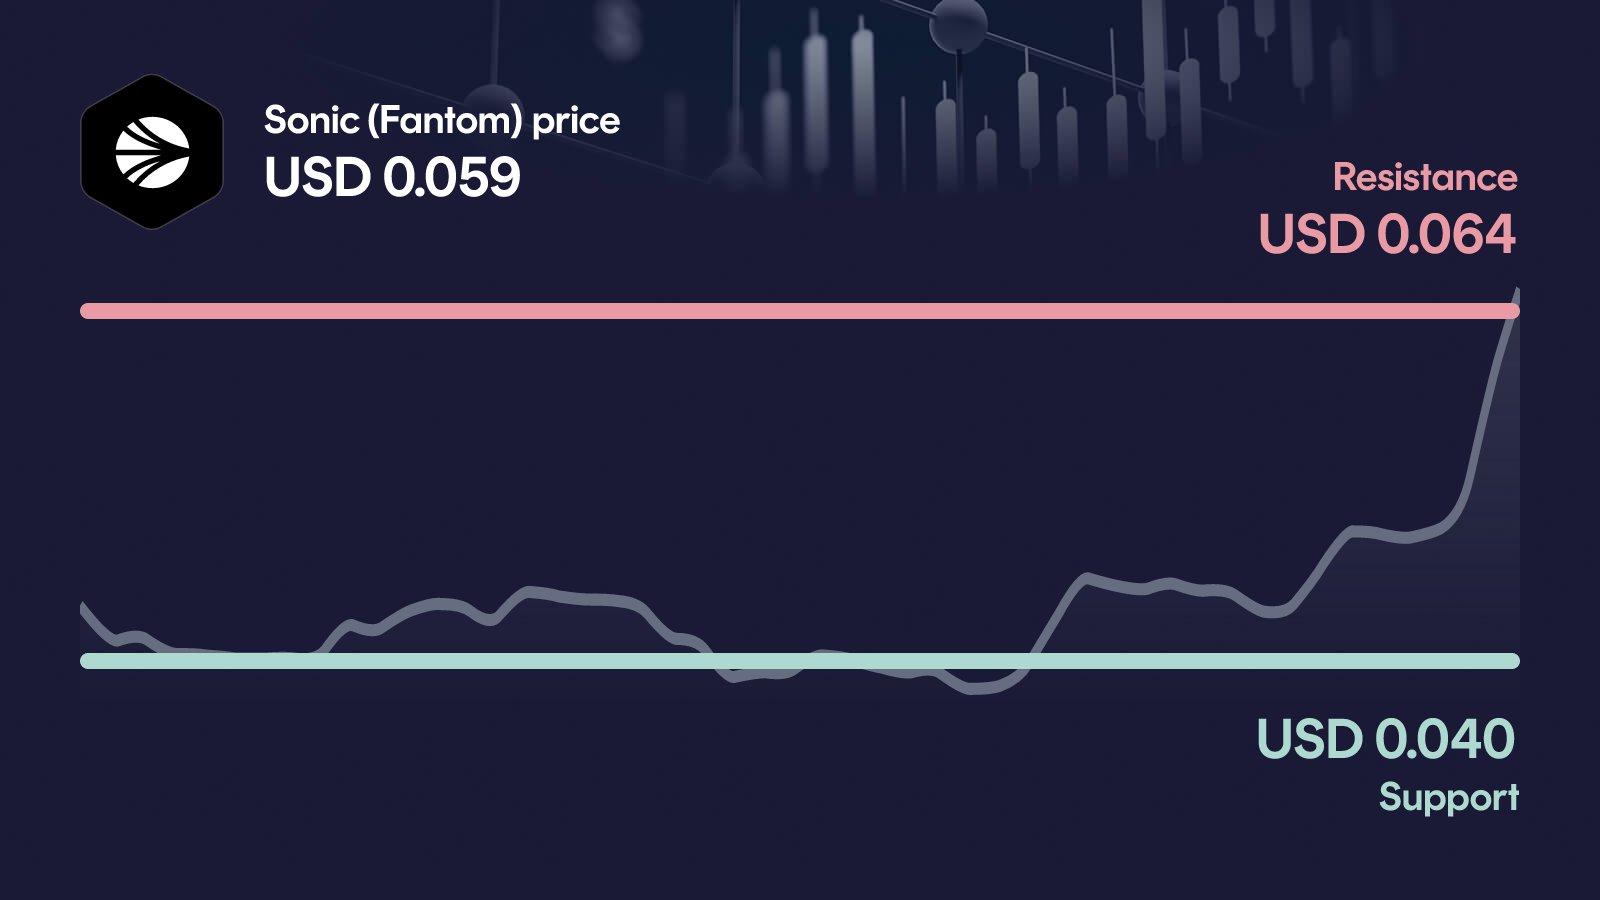
Sonic is exploding higher, up more than 20% in 24 hours and over 44% on the week, with volume running five times above its 30-day average. The move pushes S straight into the key resistance zone at $0.0636, where buyers now face their biggest test. A clean break would open the door to further upside, a rejection would quickly bring the $0.0399 support back into focus.
Key takeaways in a nutshell
Explosive 24-hour move: Sonic jumps 20.7% to $0.05873 and extends its 30-day gain to a stunning 116%, driven by a volume spike of over 500% versus the 30-day average.
Trend firmly bullish: The price trades roughly 74% above the 50-day moving average ($0.0338) and 72% above the 200-day moving average ($0.0341), a textbook strong-trend setup.
Decision at $0.0636: The primary resistance at $0.0636 is the single most important level right now. A clean breakout would unlock further upside toward the recent weekly high.
Momentum building: The RSI at 64 is strong but not yet overbought, leaving room for continuation if buyers stay in control.
AI model sees upside: Our AI forecast for year-end 2026 places Sonic in a wide range of $0.095 to $0.129, with a central value near $0.157.
What happened to the Sonic (Fantom) price?
Sonic (Fantom) is trading at $0.05873, up 20.7% in the last 24 hours and 44.3% over the past week. The move is backed by extraordinary participation: 24-hour volume of $253 million is more than five times the 30-day average, a clear sign that fresh capital is rotating into S.
Zooming out, the rally has real depth. Sonic is up 116% over 30 days and 162% over 60 days, with price now pressing against the weekly high of $0.0685. The question is no longer whether momentum exists, but whether it is strong enough to break the next barrier.
Key price levels for Sonic (Fantom)
The immediate resistance sits at $0.0636, and a decisive daily close above it would open the path toward the weekly high around $0.0685. On the downside, $0.0399 is the first major support and marks the line that bulls need to defend to keep the breakout structure intact. If that level fails, the next relevant reference would be the secondary support at $0.0326, which would signal that the current rally has lost its grip.
Sonic (Fantom) indicators: RSI, MACD and volume
The three indicators currently paint a consistent, bullish picture. The RSI at 64 is strong but still shy of the overbought zone above 70, meaning there is room for the rally to extend before momentum becomes stretched. The MACD is firmly bullish with a recent bullish crossover, confirming that trend momentum has shifted to the upside. Volume at over 500% above the 30-day average is the decisive factor: moves of this magnitude on this kind of participation are rarely random. Taken together, the signals suggest a breakout attempt with genuine conviction behind it.
Relative Strength Index
MACD
AI forecast for Sonic (Fantom)
Looking toward year-end 2026, our AI forecast model places Sonic in a range between $0.0952 and $0.1285. The central expected value sits at $0.157, but this should not be read as a price target: it is the midpoint of a broad probability distribution shaped by many potential market paths.
The range matters more than the single number, because it captures the uncertainty around a highly volatile asset. In the conservative case, Sonic would still trade roughly 60.7% above current levels, while the optimistic case within the range implies an upside of around 116.9%. Both outcomes assume that the current trend structure holds.
What could happen now?
Bullish scenario
A decisive daily close above $0.0636 on sustained volume would confirm the breakout and shift attention toward the weekly high at $0.0685. In that case, the short-term setup would clearly improve, as both the trend structure and momentum are already aligned to the upside. The RSI should not push deep into overbought territory too quickly, and MACD and volume need to keep supporting the move for the breakout to be more than a one-day spike. Afterwards, bulls would need to defend $0.0636 as new support to prevent a quick fade back into the prior range.
Trigger: > $0.0636 with elevated volume
Bearish scenario
If Sonic fails at $0.0636 and loses the $0.0399 support, the picture shifts quickly. A break below that level would invalidate the short-term breakout structure and expose the next reference at $0.0326. In this case, momentum would start to fade, the MACD impulse would weaken, and the extended distance from the moving averages would become a liability rather than a strength. A sustained move below $0.0326 would put additional pressure on the medium-term trend and raise the risk of a deeper retracement.
Trigger: < $0.0399
Conclusion: Decision at $0.0636
The technical setup is constructive, but the next few sessions will decide whether the rally has true staying power. The decisive area is the resistance zone at $0.0636, right where price is currently pressing.
A clean breakout on continued high volume would open the path toward the weekly high around $0.0685 and keep the strong trend intact. A rejection, on the other hand, would quickly put the $0.0399 support back in focus and test whether buyers are willing to defend the breakout base. The next few trading days are likely to set the direction.
Want to buy Sonic (Fantom)? Kraken is our recommended crypto trading platform.
Continue to KrakenSince 2017, Philipp Duringer has been deeply involved in Bitcoin, crypto assets and digital financial markets. As the founder of Coinbird, he combines years of crypto experience with more than 15 years of technical experience in IT and digital products. His goal is to make crypto easier to understand, more transparent and easier to compare.
About the authorAI-assisted: This price analysis is generated automatically based on structured market data and reviewed through defined quality rules. It is for informational purposes only and is not financial or investment advice or a recommendation to buy or sell crypto assets.