


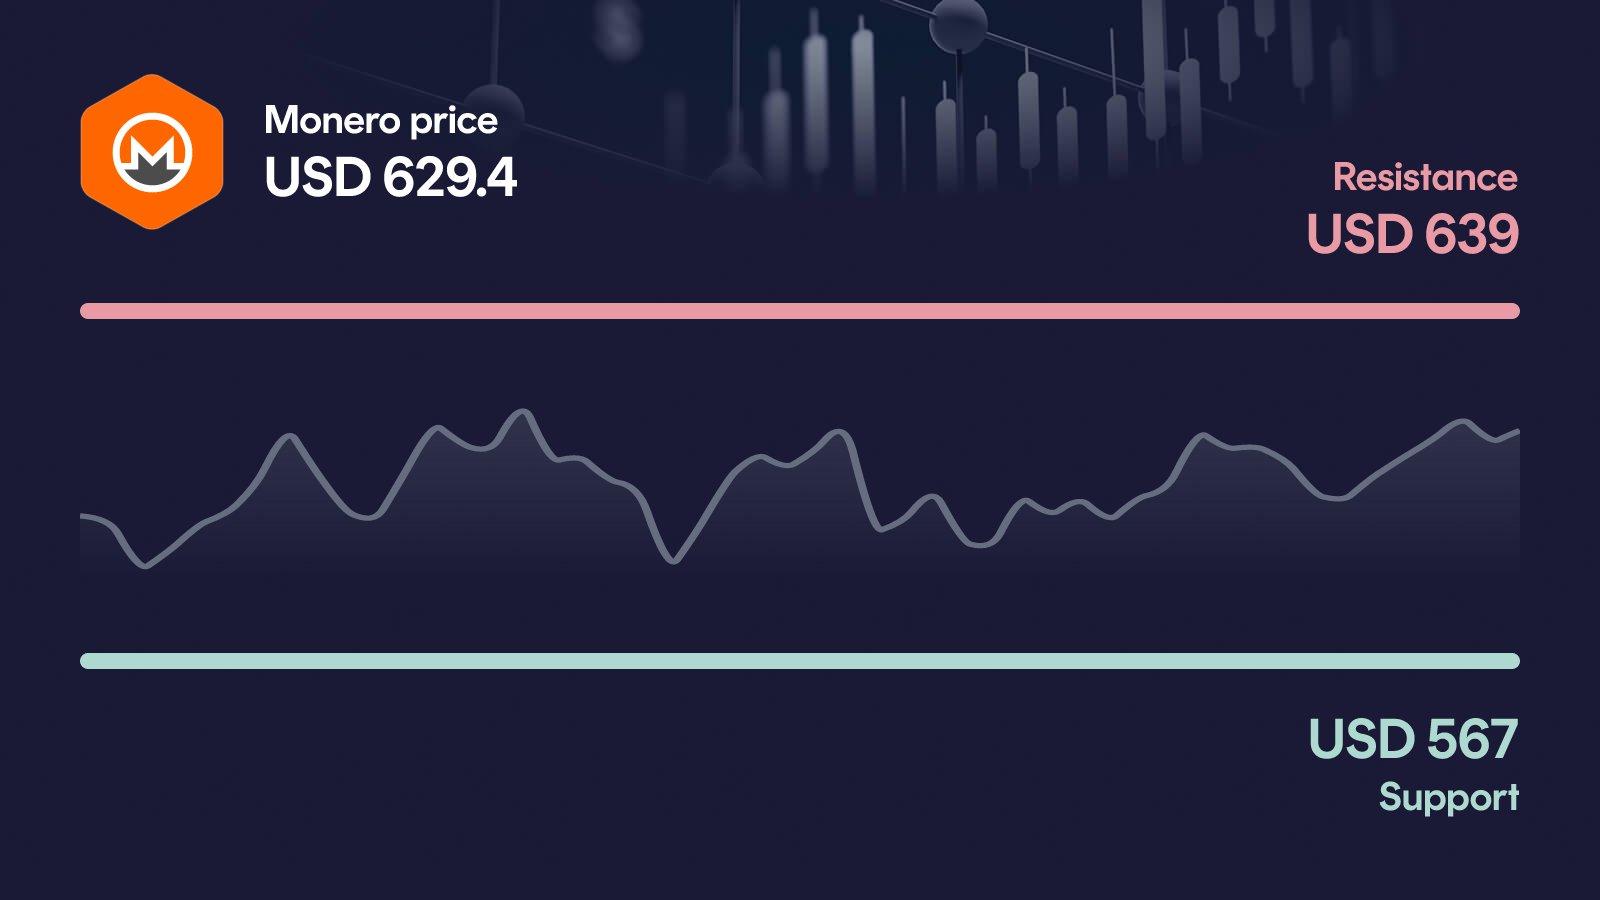
Monero is pressing right against its weekly ceiling after a 5.2% daily gain, with the $639 resistance now within reach. Volume is running 33% above the 30-day average, confirming that buyers are showing up, yet the MACD has just flipped bearish and warns against premature euphoria. A clean break above $639 would open the path to $679, while a rejection would send price back toward the $567 support.
Key takeaways in a nutshell
Push toward resistance: XMR trades at $629.40 after a 5.2% daily jump, closing in on the $639 resistance that defines the current ceiling.
Trend clearly intact: Price sits 12% above the 50-day average ($562) and 48% above the 200-day average ($425), a textbook bullish structure.
$639 is the trigger: The $639 level separates a continuation toward $679 from another rejection back into the $567–$639 range.
RSI with room: At 56, the RSI signals healthy momentum without overheating, leaving space for another leg higher.
AI sees upside: The AI forecast model projects a 2026 range of $633 to $898, with a midpoint near $773.
What happened to the Monero price?
Monero is trading at $629.40 after a 5.2% jump in the last 24 hours, pushing the price directly into the weekly high zone around $646. The move extends a strong medium-term run: +15% over 30 days and +21% over 60 days, with XMR now sitting less than $10 below the first key resistance at $639.
The most telling detail is volume. Turnover has climbed to roughly $175 million, about 33% above the 30-day average. That is the kind of participation the chart needed to make a serious attempt at the $639 ceiling, even if the all-time high at $798 remains a distant reference.
Key price levels for Monero
The first resistance sits at $639, and a clean daily close above it would open the door toward the secondary resistance at $679 and the monthly high near $656. On the downside, the primary support at $567 is the line that keeps the current uptrend structurally intact, aligning closely with the 50-day average at $562. If that zone breaks, the next relevant reference is the secondary support at $535, below which the setup would quickly lose its bullish character.
Monero indicators: RSI, MACD and volume
The three indicators currently paint a mixed picture that captures the tension in the chart. The RSI at 56 sits in a comfortable zone: enough momentum to push higher, but far from the overbought territory above 70. The MACD has just flipped bearish with a fresh negative histogram, suggesting that short-term momentum was cooling right before this latest daily rebound. Volume at 33% above average, however, confirms that buyers stepped in decisively on the move toward $639. Taken together, the setup looks constructive on trend and volume, but the MACD warns that a breakout attempt could face resistance before it fully resolves.
Relative Strength Index
MACD
AI forecast for Monero
Looking toward year-end 2026, our AI forecast model places Monero in a range between $632.70 and $897.85. The central expected value sits near $772.78, which should not be read as a price target but as the midpoint of a broad probability distribution.
The span itself is the key message: it reflects both the structural strength of the current trend and the uncertainty that comes with crypto markets. In the conservative case, the model implies roughly a 0.5% upside from current levels, while the optimistic case points to around +42.7%. That asymmetry mirrors what the chart currently shows: limited downside risk as long as support holds, with meaningful upside if the $639 resistance gives way.
What could happen now?
Bullish scenario
A daily close above $639 on sustained volume would confirm the breakout attempt and open the path toward $679, with $656 as the next orientation point along the way. In that case, the RSI would have room to extend without immediately entering overheated territory, and a MACD reversal back into positive momentum would strengthen the signal. Volume should remain above the 30-day average to validate the move. For the setup to stay intact, bulls would need to defend $567 on any pullback, keeping the structure above the 50-day average.
Trigger: > $639 with elevated volume
Bearish scenario
If XMR gets rejected at $639 and loses the $567 support, the recent fresh bearish MACD cross would gain real weight. The short-term setup would deteriorate quickly, with the secondary support at $535 becoming the next reference zone. A break below that level would put pressure on the medium-term trend by threatening the 50-day average at $562. From there, the monthly low near $515 would move into focus as the next downside orientation.
Trigger: < $567
Conclusion: Decision at $639
The technical setup is constructive, but a freshly bearish MACD leaves a crack in the picture that the market now has to resolve. The decisive area is the $639 resistance, where the recent volume surge meets the weekly ceiling.
A clean break above $639 would unlock the path toward $679 and bring the monthly high back into play. A rejection, by contrast, would send price back into the $567–$639 range and put the primary support under scrutiny. As long as $567 holds, the broader uptrend remains intact. The next few trading days are likely to set the direction.
Want to buy Monero? Kraken is our recommended crypto trading platform.
Continue to KrakenSince 2017, Philipp Duringer has been deeply involved in Bitcoin, crypto assets and digital financial markets. As the founder of Coinbird, he combines years of crypto experience with more than 15 years of technical experience in IT and digital products. His goal is to make crypto easier to understand, more transparent and easier to compare.
About the authorAI-assisted: This price analysis is generated automatically based on structured market data and reviewed through defined quality rules. It is for informational purposes only and is not financial or investment advice or a recommendation to buy or sell crypto assets.
