
This Hyperliquid price analysis was published on and is not the latest edition.
Hyperliquid is under pressure and testing the critical support zone around $52. The MACD remains bearish, volume is running well below average and buyers have shown little strength so far. If this level breaks, the correction could accelerate toward the next reference points.
Key takeaways in a nutshell
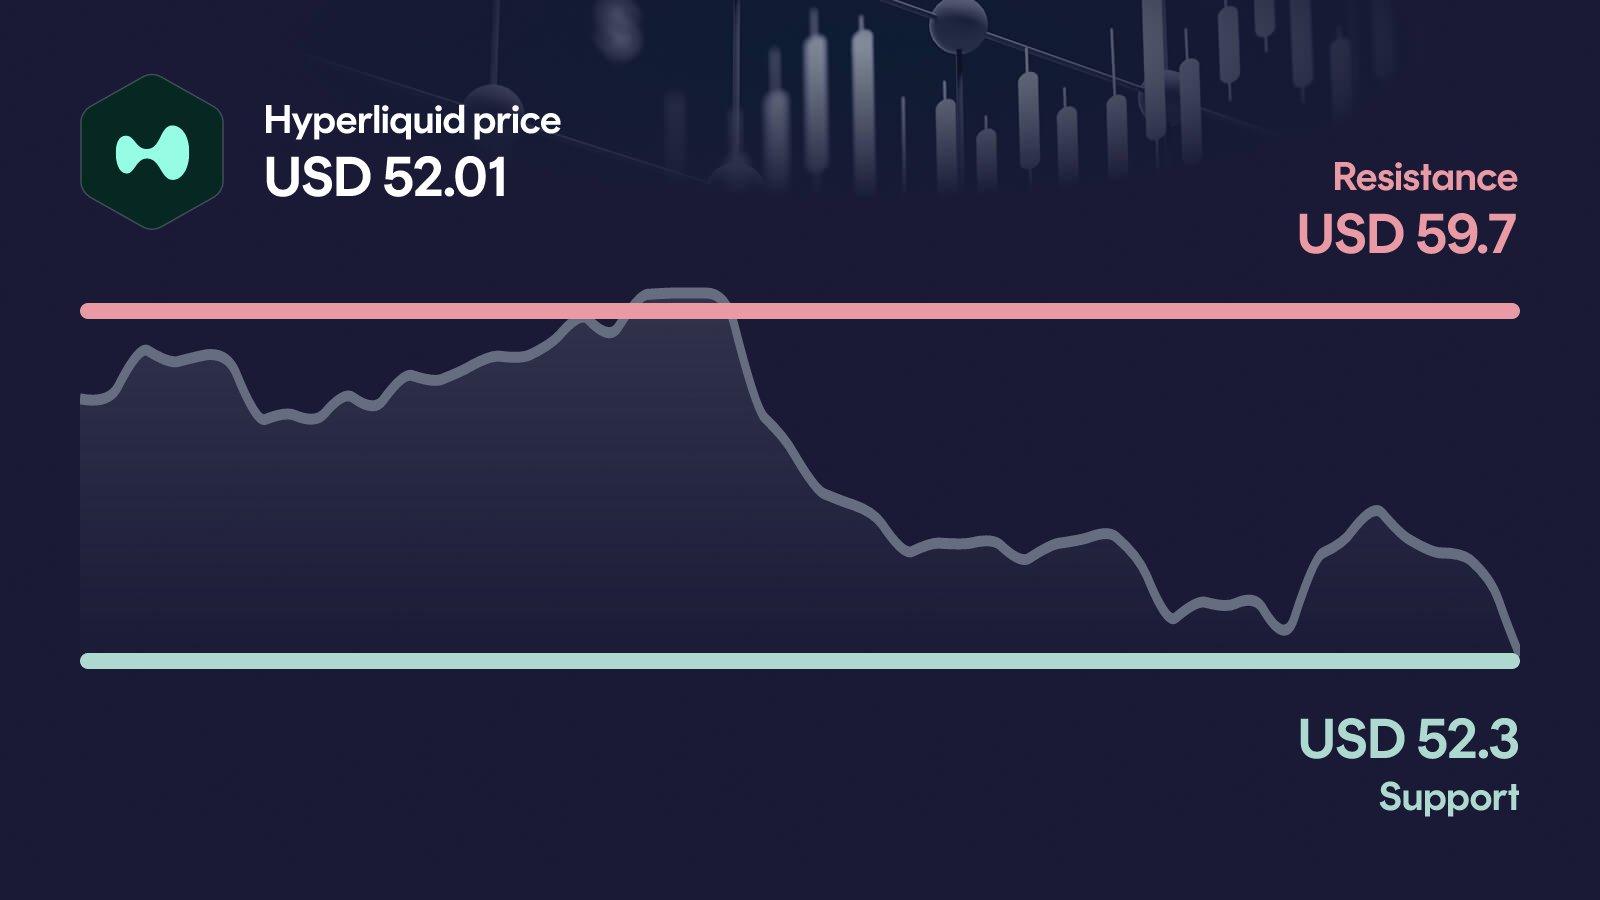
Support under pressure: HYPE trades at $52.01, right on top of the $52.30 support that now decides the short-term direction.
Trend picture cracks: The price sits 18.6% below the 50-day average at $63.90, while the 200-day at $45.40 remains the last major backstop.
Decision level: Above $59.70, the setup would improve clearly. Below $52, the next relevant zone opens up quickly.
Momentum fades: RSI at 39 signals weakness without full oversold territory, and MACD stays firmly bearish at -2.58.
AI sees wide range: Our AI model projects a 2026 year-end range of $77 to $128, well above current levels but with high uncertainty.
What happened to the Hyperliquid price?
Hyperliquid is trading at $52.01, down 1.2% over the last 24 hours and 10.9% over the past week. On a 30-day view, HYPE has lost 21.6%, and the current price is sitting right at the weekly low of $52, well below the weekly high of $60.40.
The most notable signal is volume: 24-hour turnover of roughly $236 million is 38.8% below the 30-day average. In other words, the sell-off is happening on thin participation, which makes the current test of support look less like panic selling and more like a slow, grinding drift toward a decision point.
Key price levels for Hyperliquid
These are the key zones now: The resistance at $59.70 is the next major hurdle, and a move above it would be the first serious sign that the pullback has ended. On the downside, the area around $52.30 acts as support, and it lines up almost exactly with the current price, making it the immediate decision zone. If Hyperliquid falls below it, the next relevant level near $49 becomes the key reference point.
Hyperliquid indicators: RSI, MACD and volume
The three indicators currently paint a consistent picture on the weak side. The RSI at 39 shows clear downside momentum without yet reaching classic oversold territory, meaning there is still room for further weakness before a technical rebound becomes likely. The MACD stays bearish at -2.58, confirming that trend momentum has not turned yet and that recent green candles were not enough to flip the signal. Volume tells the same story: at 38.8% below the 30-day average, buyers are simply not stepping in with conviction. Taken together, the setup looks fragile and favors the bears until at least one of these signals turns.
Relative Strength Index
MACD
AI forecast for Hyperliquid
Looking toward year-end 2026, our AI forecast model places Hyperliquid in a broad range between $77.48 and $127.74. The central expected value comes in near $104.58, but this is not a price target: it is the midpoint of a broad probability distribution and should be treated as such.
The range matters far more than the midpoint, because it reflects how uncertain the setup remains after the recent sell-off. In the conservative case, HYPE would still be about 49.1% above the current price, while the optimistic case implies a move of roughly 145.9% from here. That spread underlines both the recovery potential and the risk that the current weakness has to be worked off first.
What could happen now?
Bullish scenario
For a bullish turn, Hyperliquid would need to reclaim the $59.70 resistance on clearly rising volume. That would signal that buyers are stepping back in and that the recent lows are being defended. In such a scenario, RSI should climb back above 50 without overheating, while MACD would need to work toward a bullish crossover to confirm the shift. The $52 area should then hold as new support on any pullback, otherwise the breakout attempt would quickly lose credibility.
Trigger: > $59.70 with elevated volume
Bearish scenario
The bearish setup activates if HYPE loses the $52.30 support on a daily close. In that case, the short-term picture would deteriorate quickly, with the next reference near $49 and the secondary support zone becoming the immediate focus. RSI would likely push into oversold territory, but the bearish MACD and weak volume suggest that dip buyers may stay cautious. A sustained move below $49 would put clear pressure on the medium-term trend and open the way toward the lower orientation area.
Trigger: < $52.30
Conclusion: $52 level decides the direction
The technical setup is fragile, but not yet broken, as the price is holding right at its most important short-term support. The decisive area is the $52 to $52.30 zone, which currently separates a controlled pullback from an accelerating correction.
If this level holds and buyers can push HYPE back above $59.70, the picture would improve markedly and the recent weakness could be reframed as a shakeout. If support breaks, the path toward $49 opens quickly, and the medium-term trend would come under real pressure. With RSI weak, MACD bearish and volume well below average, the burden of proof lies with the bulls. The next few trading days are likely to set the direction.
Want to buy Hyperliquid? Kraken is our recommended crypto trading platform.
Continue to KrakenSince 2017, Philipp Duringer has been deeply involved in Bitcoin, crypto assets and digital financial markets. As the founder of Coinbird, he combines years of crypto experience with more than 15 years of technical experience in IT and digital products. His goal is to make crypto easier to understand, more transparent and easier to compare.
About the authorAI-assisted: This price analysis is generated automatically based on structured market data and reviewed through defined quality rules. It is for informational purposes only and is not financial or investment advice or a recommendation to buy or sell crypto assets.