
This Canton price analysis was published on and is not the latest edition.
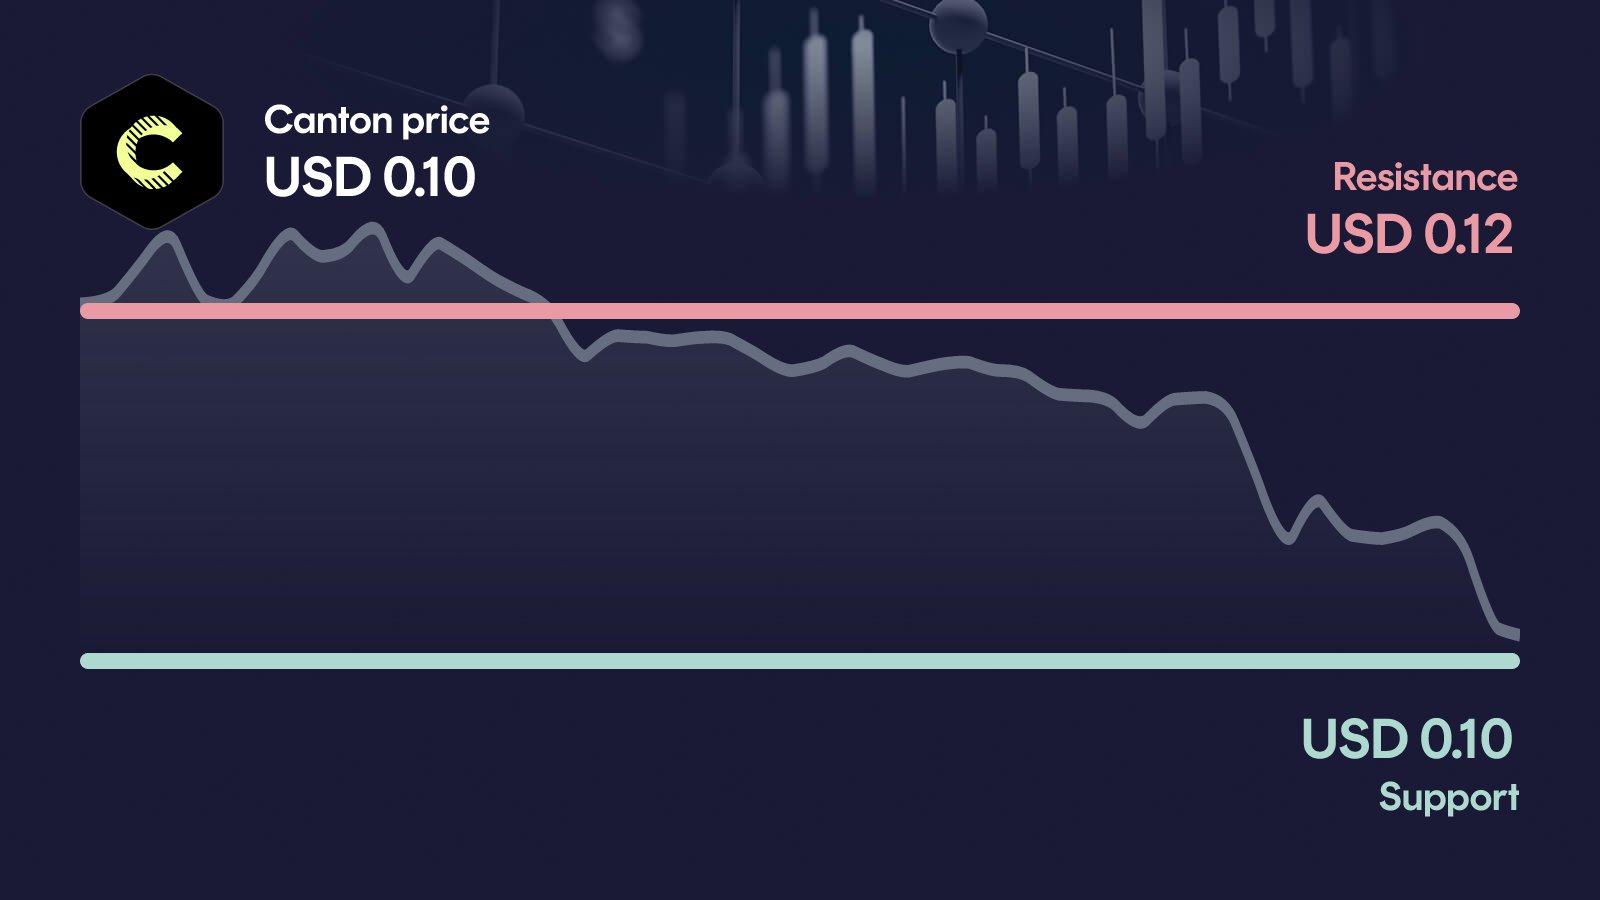
Canton is under heavy pressure. The price has slid to $0.1027 and is now pressing directly against the primary support at $0.103, with RSI already deep in oversold territory at 27 and MACD still bearish. If this zone breaks, the next relevant reference lies at $0.0974, and the entire short-term structure could unravel.
Key takeaways in a nutshell
Support under pressure: Canton trades at $0.1027 after losing 16.2% in seven days and now sits directly on primary support at $0.103.
Trend clearly bearish: The price is 23.9% below the 50-day average ($0.135) and 31.5% below the 200-day average ($0.15).
$0.103 is the line: A daily close below $0.103 opens the door toward secondary support at $0.0974.
RSI deeply oversold: At 27, the RSI signals extreme selling pressure, which historically allows for short-term rebounds but does not confirm a reversal.
AI sees room higher: The AI forecast model for 2026 places Canton between $0.1225 and $0.2231, with a midpoint near $0.1653.
What happened to the Canton price?
Canton is trading at $0.1027 and has lost another 5% in the past 24 hours. The picture over longer timeframes is even harsher: 16.2% down in seven days, 25.1% down in 30 days. The weekly high at $0.124 already feels far away, while the current price is pressing directly against the weekly low at $0.102.
What stands out is volume: with $12.8 million in 24-hour turnover, activity sits 26.2% above the 30-day average. That means the sell-off is not happening quietly, but with clearly elevated participation, which raises the significance of the level currently being tested.
Key price levels for Canton
On the upside, the first relevant barrier stands at $0.119, and only a reclaim of this zone would ease the immediate pressure and open the path toward the secondary resistance at $0.13. On the downside, primary support at $0.103 is decisive: the current price is essentially sitting on this level, and it is the last defensive line before the structure weakens further. If this zone gives way, the next logical reference is the secondary support at $0.0974.
Canton indicators: RSI, MACD and volume
The three indicators currently paint a mixed but tension-loaded picture. The RSI at 27 sits deep in oversold territory, which points to exhausted sellers in the short term but is not a reversal signal on its own. The MACD remains bearish with a recent bearish crossover, confirming that momentum is still on the downside. Volume runs 26.2% above the 30-day average, showing that the move into support is happening with conviction rather than in thin trade. Taken together, the setup describes a market under active pressure that has reached a technically stretched state right at a decisive level.
Relative Strength Index
MACD
AI forecast for Canton
Looking toward year-end 2026, our AI forecast model places Canton in a range between $0.1225 and $0.2231. The central expected value sits at around $0.1653, but this figure is not a price target: it is the midpoint of a broad probability distribution and reflects the model's average scenario, not a promised outcome.
The width of the range matters more than the midpoint itself. In the conservative case, that corresponds to a potential upside of roughly 19.1% from current levels; in the optimistic case, the model sees room for 116.9%. Such a spread signals that the model views Canton's medium-term path as highly dependent on which of the current key levels holds first.
What could happen now?
Bullish scenario
A bullish setup would require Canton to first defend the $0.103 zone convincingly and then reclaim $0.119 on strong volume. Such a move would neutralize the recent bearish MACD signal and shift short-term momentum, especially with the RSI leaving oversold territory from below. Ideally, the RSI should not overheat immediately, and volume should stay elevated to confirm real demand rather than a short-covering spike. As long as Canton then holds above $0.103 on any pullback, the door toward the secondary resistance at $0.13 would remain open.
Trigger: > $0.119 with elevated volume
Bearish scenario
The bearish case activates on a daily close clearly below $0.103. In that situation, the last defensive support would be gone, the MACD would keep confirming downside momentum, and the elevated volume would work against buyers rather than for them. The next logical reference is the secondary support at $0.0974, which is also the 30-day low. A sustained break of that area would put additional pressure on the medium-term trend, with the price already sitting 31.5% below its 200-day average.
Trigger: < $0.103
Conclusion: $0.103 level decides the direction
The technical setup is fragile, but the extremely oversold RSI at 27 adds a layer of tension to the picture. The decisive area is the $0.103 support zone, where the current price is essentially standing.
If Canton defends this level and manages to push back toward $0.119, an oversold bounce could develop into something more meaningful. If $0.103 breaks on a daily close, the path toward $0.0974 opens quickly, and the broader downtrend gets fresh confirmation. The next few trading days are likely to set the direction.
Want to buy Canton? Kraken is our recommended crypto trading platform.
Continue to KrakenSince 2017, Philipp Duringer has been deeply involved in Bitcoin, crypto assets and digital financial markets. As the founder of Coinbird, he combines years of crypto experience with more than 15 years of technical experience in IT and digital products. His goal is to make crypto easier to understand, more transparent and easier to compare.
About the authorAI-assisted: This price analysis is generated automatically based on structured market data and reviewed through defined quality rules. It is for informational purposes only and is not financial or investment advice or a recommendation to buy or sell crypto assets.