
Avalanche is back in focus: AVAX jumps more than 10% in 24 hours to $8.64 and pushes directly against the first key resistance at $8.85. Trading volume is more than double the 30-day average, giving the move real weight. Now the question is whether buyers can clear the zone or whether the rally stalls again right below it.
Key takeaways in a nutshell
Sharp daily rebound: AVAX trades at $8.64 after a 10.1% jump in 24 hours, breaking out of the lower end of its monthly range near $7.83.
Trend still split: Price sits 12.8% below the 50-day average at $9.91 but 6.3% above the 200-day average at $8.13 — a classic transition zone.
$8.85 is the line: Resistance at $8.85 is the decisive level; above it, the path opens toward $9.48 and the monthly high at $11.10.
RSI leaves oversold: The RSI at 37 is turning up from oversold territory, signaling that the sell-off pressure is easing without the chart being overheated.
AI sees upside bias: Our AI model projects a 2026 range of $8.17 to $10.49, with a midpoint around $9.49 — a potential plus of up to 21.1%.
What happened to the Avalanche price?
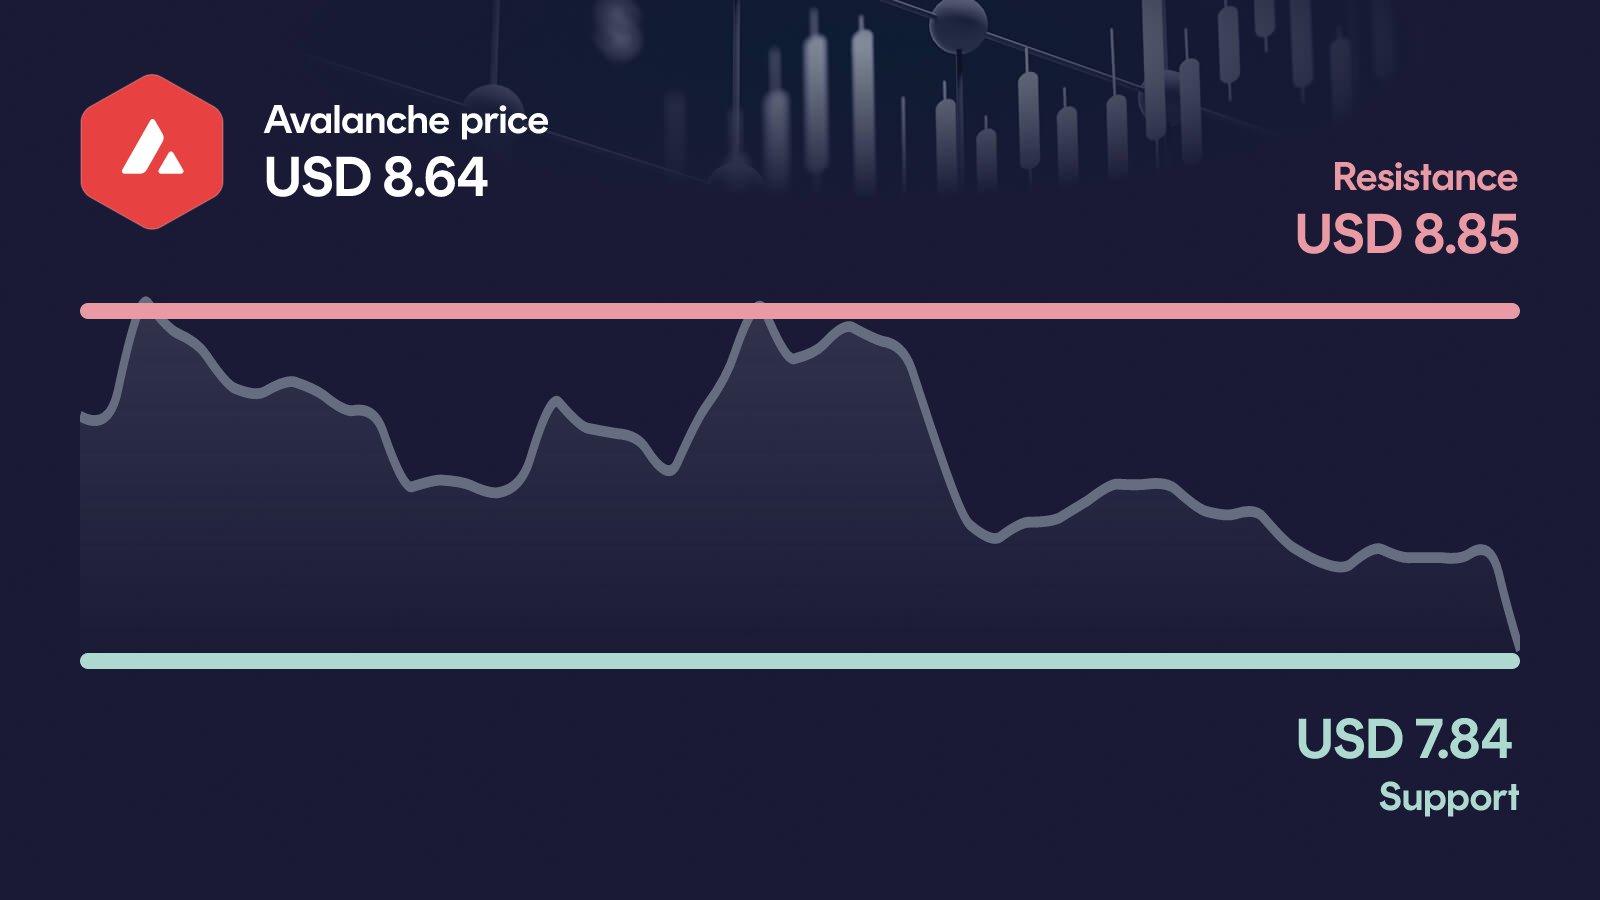
Avalanche is staging a notable rebound: AVAX trades at $8.64, up 10.1% in 24 hours and back within striking distance of the weekly high at $9.10. The bounce comes directly from the monthly low at $7.83, which has now held as support twice in recent sessions.
The move is backed by heavy flow. Daily volume of roughly $530 million is 117% above the 30-day average, which turns this rebound into more than just a routine bounce. On a longer view, the picture stays mixed: AVAX is still down 17.3% over 30 days and 51.2% year-on-year, so this jump is a counter-move inside a broader downtrend.
Key price levels for Avalanche
The first hurdle sits at $8.85: a daily close above this level would open the path toward the next resistance at $9.48 and, further out, the monthly high near $11.10. On the downside, $7.84 is the decisive support, exactly matching the monthly low and the zone from which the current rebound started. If that floor gives way, the next orientation point is the secondary support at $7.47, which would clearly weaken the short-term setup.
Avalanche indicators: RSI, MACD and volume
The three indicators currently paint a mixed, but improving picture. The RSI at 37 is climbing out of oversold territory, which typically marks the end of acute selling pressure rather than the start of an overheated move. The MACD remains bearish at -0.40, but its histogram has been narrowing steadily over the last 14 sessions, from -0.19 toward -0.03 — a sign that downside momentum is fading. Volume at 117% above the 30-day average adds real weight to the rebound and separates it from a low-conviction technical bounce. Taken together, the setup looks like an early momentum shift, with the MACD still needing to confirm what price and volume are already suggesting.
Relative Strength Index
MACD
AI forecast for Avalanche
Looking toward year-end 2026, our AI forecast model places AVAX in a range between $8.17 and $10.49. The central expected value sits near $9.49, which should not be read as a price target but as the midpoint of a broad probability distribution.
The width of that range is the actual message: it reflects how undecided the market currently is between a trend stabilization above the 200-day average and a renewed test of the lows. In the conservative scenario, AVAX would trade around 5.7% below today's price, while the optimistic end implies an upside of roughly 21.1%. For the model's upper half to come into play, the $8.85 resistance would need to fall convincingly.
What could happen now?
Bullish scenario
A clean daily close above $8.85 would be the first serious signal that the rebound is turning into something more than a technical bounce. In that case, the next targets would be $9.48 and, further out, the monthly high at $11.10. For the move to stay credible, the RSI should rise without quickly running into overbought territory, and volume should remain above the 30-day average to confirm real demand. As long as AVAX then defends the $8.13 area around the 200-day moving average, the short-term setup would clearly brighten.
Trigger: > $8.85 with elevated volume
Bearish scenario
The decisive line on the downside is $7.84. A daily close below this zone would invalidate the current rebound and bring the secondary support at $7.47 into direct focus. In that case, the MACD would likely reaffirm its bearish signal and the RSI could slide back into oversold territory. A sustained move below $7.47 would put additional pressure on the medium-term trend and reopen the discussion around the broader monthly downtrend of -17.3%.
Trigger: < $7.84
Conclusion: Decision at $8.85
The technical setup is mixed but visibly improving, with a 10% rebound on more than double the average volume. The decisive area is the zone between $7.84 on the downside and $8.85 on the upside.
A clean break above $8.85 would open the way toward $9.48 and potentially the monthly high at $11.10, turning the current bounce into a genuine trend attempt. A loss of $7.84, by contrast, would reactivate the downside and expose the secondary support at $7.47. With RSI leaving oversold territory and the MACD histogram narrowing, momentum is quietly shifting, but confirmation is still missing. The next few trading days are likely to set the direction.
Want to buy Avalanche? Kraken is our recommended crypto trading platform.
Continue to KrakenSince 2017, Philipp Duringer has been deeply involved in Bitcoin, crypto assets and digital financial markets. As the founder of Coinbird, he combines years of crypto experience with more than 15 years of technical experience in IT and digital products. His goal is to make crypto easier to understand, more transparent and easier to compare.
About the authorAI-assisted: This price analysis is generated automatically based on structured market data and reviewed through defined quality rules. It is for informational purposes only and is not financial or investment advice or a recommendation to buy or sell crypto assets.