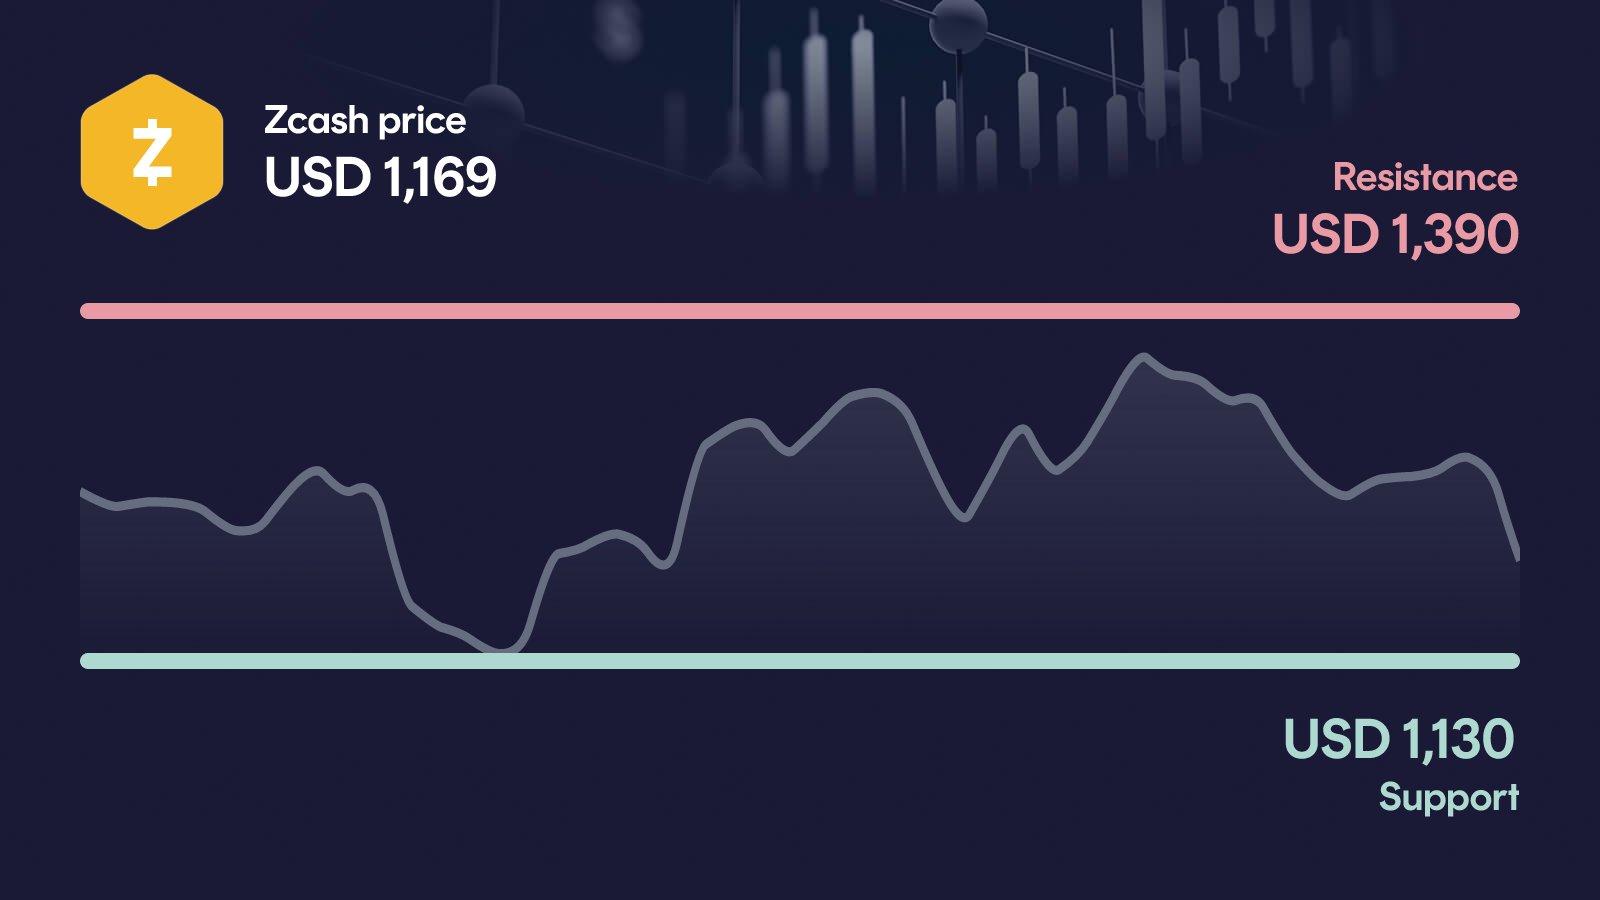
Zcash comes under pressure and slides 6.6% in 24 hours to $1,169, pushing the price right into the key support zone around $1,130. Volume is running well above the 30-day average, which gives the move extra weight. If $1,130 fails, the next downside reference opens quickly.
Key takeaways in a nutshell
Sharp daily drop: ZEC falls 6.6% in 24 hours to $1,169 and tests the lower edge of the recent range near $1,130.
Trend is split: The price trades 10.8% below the 50-day average at $1,310, but still 51.8% above the 200-day at $770.
Support under pressure: $1,130 is the decisive line in the sand; below it, $1,050 becomes the next relevant level.
Momentum is neutral: RSI sits at 51, giving neither bulls nor bears a clear edge in the current pullback.
AI sees upside room: The AI forecast model places ZEC between $1,339 and $2,441 by year-end 2026, with $1,808 as the midpoint.
What happened to the Zcash price?
Zcash is down 6.6% in the last 24 hours and now trades at $1,169, slipping toward the lower boundary of the current weekly range between $1,120 and $1,380. The move brings ZEC uncomfortably close to the primary support at $1,130, a level that has defined the floor of recent trading.
Over seven days the price is almost flat at -0.5%, and the 30-day performance of -4.6% shows that the market has been losing altitude from the monthly high at $1,390. What stands out is volume: 24-hour turnover of $1.11 billion sits 22.7% above the 30-day average, meaning this drop is not happening quietly.
Key price levels for Zcash
On the upside, the key resistance is the monthly high at $1,390; a clean reclaim would reopen the path toward the next barrier around $1,510. On the downside, $1,130 is the decisive support that bulls need to defend, as it currently separates a normal pullback from a deeper structural break. If this zone gives way, the next relevant orientation point is the monthly low area around $1,050.
Zcash indicators: RSI, MACD and volume
The three indicators currently paint a mixed picture that mirrors the tension in the price action. RSI stands at 51, a strictly neutral reading that leaves room in both directions and shows neither exhaustion nor capitulation. MACD is still technically bullish with a value of 6.12 and a positive histogram, but the recent dip into negative territory before recovering signals that momentum is fragile. Volume is the clearest signal: at 22.7% above the 30-day average, participation is elevated, and heavy turnover on a down day typically reflects distribution rather than accumulation. Together, the trio suggests a market at a decision point, where the next close either stabilizes the setup or confirms further downside.
Relative Strength Index
MACD
AI forecast for Zcash
Looking toward year-end 2026, our AI forecast model places Zcash in a broad range between $1,339 and $2,441. The central expected value sits at $1,808, but this figure should not be read as a price target: it is simply the midpoint of a wide probability distribution.
The spread itself is the most important part of the forecast, because it reflects how much volatility the model expects for a privacy coin that has already multiplied several times over the past year. In the conservative case, that would imply upside of about 14.2% from current levels, while the optimistic scenario corresponds to a potential gain of roughly 108%. Both ends of that range underline that the current pullback plays out against a much larger backdrop.
What could happen now?
Bullish scenario
The bullish case needs ZEC to first stabilize above $1,130 and then push back through the monthly high at $1,390 on strong volume. That move would invalidate the recent pullback and put the next resistance around $1,510 back into focus. For the setup to stay healthy, RSI should climb without immediately overheating above 70, and MACD would need to expand its positive histogram again. Crucially, any recovery attempt should not lose the $1,130 level again, otherwise the breakout thesis quickly loses credibility.
Trigger: > $1,390 with elevated volume
Bearish scenario
The bearish case triggers if ZEC loses $1,130 on a daily close, especially with the kind of above-average volume seen in the current drop. That would confirm the rejection from the $1,380–$1,390 area and open the path toward the monthly low region around $1,050. Momentum would likely deteriorate quickly: RSI could slide below 40, and MACD would risk flipping negative again. A sustained move below $1,050 would then put the secondary support at $995 in play and seriously weaken the medium-term structure that still sits well above the 200-day average.
Trigger: < $1,130
Conclusion: $1,130 level decides the direction
The technical setup is mixed but not broken, with ZEC still 51.8% above its 200-day average while sliding below the 50-day. The decisive area is the support band around $1,130, where the current pullback meets the floor of the recent range.
A defense of $1,130 followed by a reclaim of $1,390 would reopen the bullish structure and point back toward $1,510. A clean break below $1,130, on the other hand, would expose $1,050 and shift momentum firmly to the bears. With volume already running well above average, the market is clearly paying attention. The next few trading days are likely to set the direction.
Want to buy Zcash? Kraken is our recommended crypto trading platform.
Continue to KrakenSince 2017, Philipp Duringer has been deeply involved in Bitcoin, crypto assets and digital financial markets. As the founder of Coinbird, he combines years of crypto experience with more than 15 years of technical experience in IT and digital products. His goal is to make crypto easier to understand, more transparent and easier to compare.
About the authorAI-assisted: This price analysis is generated automatically based on structured market data and reviewed through defined quality rules. It is for informational purposes only and is not financial or investment advice or a recommendation to buy or sell crypto assets.