This ASI (Fetch.ai) price analysis was published on and is not the latest edition.
ASI (Fetch.ai) is pushing hard against a key ceiling: FET jumped more than 13% in 24 hours and is now trading at $0.2555, right at the primary resistance at $0.247. Volume is almost 90% above the 30-day average, MACD stays bullish and the price sits well above both the 50- and 200-day moving averages. Now the question is whether this is the breakout attempt bulls have been waiting for, or just another rejection at a critical zone.
Key takeaways in a nutshell
Explosive daily move: FET jumps 13.1% in 24 hours to $0.2555 and tags the weekly high at $0.259, extending a powerful 30-day rally of over 65%.
Trend firmly intact: The price trades 46.8% above the 50-day average ($0.174) and 33% above the 200-day average ($0.192), confirming a clearly bullish structure.
Resistance in focus: The decisive zone sits at $0.247, with secondary resistance at $0.275. A clean break would open fresh upside; a rejection would send FET back toward support at $0.203.
Momentum healthy: RSI at 57 shows strength without overheating, leaving room for further upside before classic overbought conditions kick in.
AI model constructive: The AI forecast for 2026 ranges from $0.449 to $1.649, with a central value of $0.819, implying a conservative upside of around 77%.
What happened to the ASI (Fetch.ai) price?
ASI (Fetch.ai) is making a loud statement: FET surged 13.1% within 24 hours and is now trading at $0.2555, pressing directly against the key resistance at $0.247 and brushing the weekly high at $0.259. The move extends a remarkable run of more than 65% over the last 30 days and 77% over 60 days.
What makes the move stand out is the volume behind it. Daily turnover of $219 million sits roughly 89% above the 30-day average of $116 million, signaling genuine buying interest rather than a thin squeeze. After weeks of grinding higher, FET has arrived at the level that decides whether this rally gets a second wind.
Key price levels for ASI (Fetch.ai)
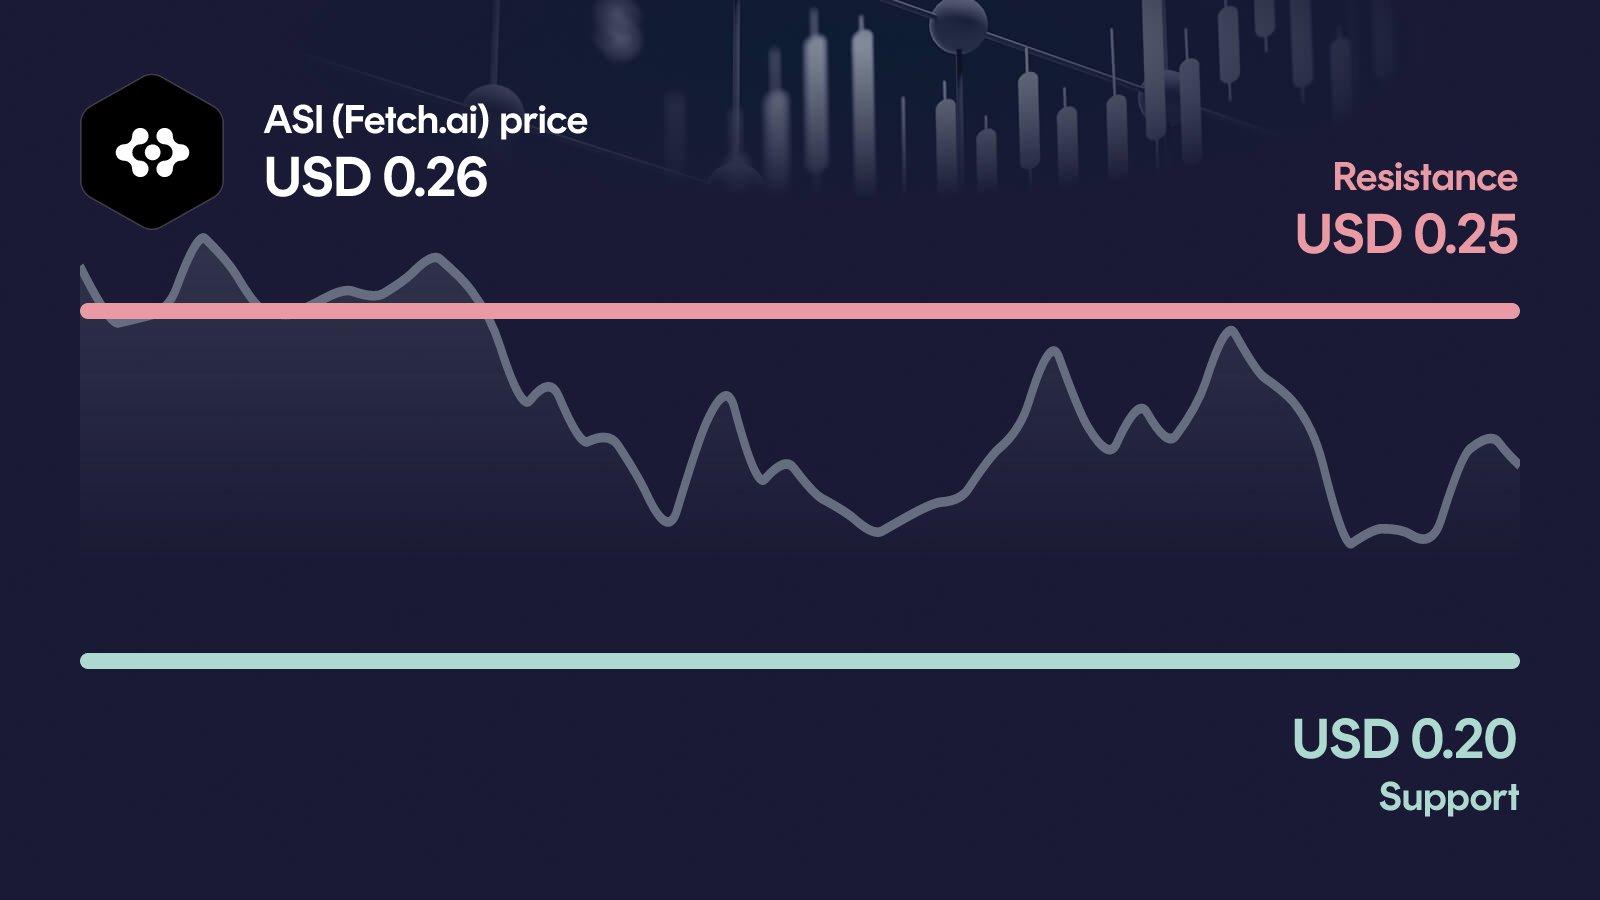
The decisive resistance sits at $0.247, right where price is currently pressing; a confirmed break above would clear the path toward the next barrier at $0.275. On the downside, support is defined at $0.203, a level that would need to hold to keep the broader uptrend structure intact. Should that floor give way, the next meaningful reference is secondary support at $0.186.
ASI (Fetch.ai) indicators: RSI, MACD and volume
The three indicators currently paint a consistent bullish picture. RSI at 57 reflects solid momentum with clear room to run before entering overbought territory, which is exactly what bulls want to see at a resistance test. MACD remains in bullish territory with a positive value and the histogram holding above zero, confirming that trend momentum is still intact even if the latest bars show some flattening. Volume at 89% above the 30-day average underlines that today's move is backed by real participation, not drift. Taken together, the setup argues that FET is approaching the $0.247 zone with the kind of fuel breakouts typically require.
Relative Strength Index
MACD
AI forecast for ASI (Fetch.ai)
Looking toward year-end 2026, our AI forecast model places FET in a range between $0.449 and $1.649. The central expected value sits at $0.819, but this should not be read as a price target: it is the midpoint of a broad probability distribution, not a prediction.
The width of this range matters more than the midpoint. It tells the story of an asset with meaningful upside potential but also considerable path dependency. In the conservative case, FET would still trade roughly 77% above current levels, while the optimistic end of the spectrum implies a gain of around 549%. That spread captures just how much the next technical decision at $0.247 could shape the trajectory into year-end.
What could happen now?
Bullish scenario
A confirmed daily close above $0.247 on sustained volume would open the next leg toward $0.275, the secondary resistance. In that case, FET would clear the weekly high at $0.259 and strengthen the already firm trend structure above both moving averages. For the move to carry, RSI should stay below classic overbought levels and MACD plus volume need to keep supporting the push. The key: once broken, the $0.247 zone must flip from resistance into support and should not be lost again on a pullback.
Trigger: > $0.247 with elevated volume
Bearish scenario
If FET fails at $0.247 and rolls over, the first critical test comes at support near $0.203. A break below that level would damage the short-term setup, likely flip MACD momentum and push RSI back toward neutral or weaker readings. The next reference would then be secondary support at $0.186, with a deeper slide putting the medium-term trend and even the 30-day low around $0.149 back in focus. In that scenario, the current rally would look more like a resistance rejection than a breakout attempt.
Trigger: < $0.203
Conclusion: Decision at $0.247
The technical setup is constructive, but FET now has to prove it at the single most important level in the current range. The decisive area is the $0.247 resistance, framed by the weekly high at $0.259 just above.
A clean breakout with volume opens the door toward $0.275 and keeps the strong 30- and 60-day momentum alive. A rejection, by contrast, would send price back toward $0.203, where the real test of the uptrend begins. With RSI healthy, MACD bullish and volume well above average, the ingredients are in place: the next few trading days are likely to set the direction.
Want to buy ASI (Fetch.ai)? Kraken is our recommended crypto trading platform.
Continue to KrakenSince 2017, Philipp Duringer has been deeply involved in Bitcoin, crypto assets and digital financial markets. As the founder of Coinbird, he combines years of crypto experience with more than 15 years of technical experience in IT and digital products. His goal is to make crypto easier to understand, more transparent and easier to compare.
About the authorAI-assisted: This price analysis is generated automatically based on structured market data and reviewed through defined quality rules. It is for informational purposes only and is not financial or investment advice or a recommendation to buy or sell crypto assets.