
Algorand is exploding higher, jumping 14% in 24 hours to $0.1335 and blasting through the $0.127 resistance on nearly 350% above-average volume. The move puts ALGO 44% above its 50-day average and lines up the next battle at $0.135. Now the question is whether bulls can convert this breakout into a sustained trend, or whether an overheated RSI triggers a fast rejection.
Key takeaways in a nutshell
Explosive daily move: ALGO trades at $0.1335, up 14% in 24 hours and 19% over the week, breaking cleanly above the $0.127 resistance.
Trend fully intact: Price sits 44% above the 50-day average ($0.0925) and 35% above the 200-day ($0.0991), a clearly bullish structure.
Decision at $0.135: The next critical zone is $0.135. A daily close above opens the door higher, while rejection risks a pullback toward $0.127.
RSI runs hot: RSI at 69 sits right at the overbought threshold, signaling strong momentum but rising short-term reversal risk.
AI sees upside room: Our AI model projects a 2026 range of $0.12 to $0.22, with the midpoint around $0.165, roughly 21% above spot.
What happened to the Algorand price?
Algorand is on a tear. ALGO trades at $0.1335, up 14% in the last 24 hours and 19% over the past seven days, punching through the $0.127 resistance zone that had capped previous attempts. Zoom out and the picture gets even stronger: 52% in 30 days and nearly 70% over 60 days.
The standout detail is volume. Turnover in the last 24 hours hit $202 million, roughly 349% above the 30-day average. That is not a quiet drift higher, it is aggressive buying pressure driving the move, and it separates this breakout attempt from the failed pushes earlier in the range.
Key price levels for Algorand
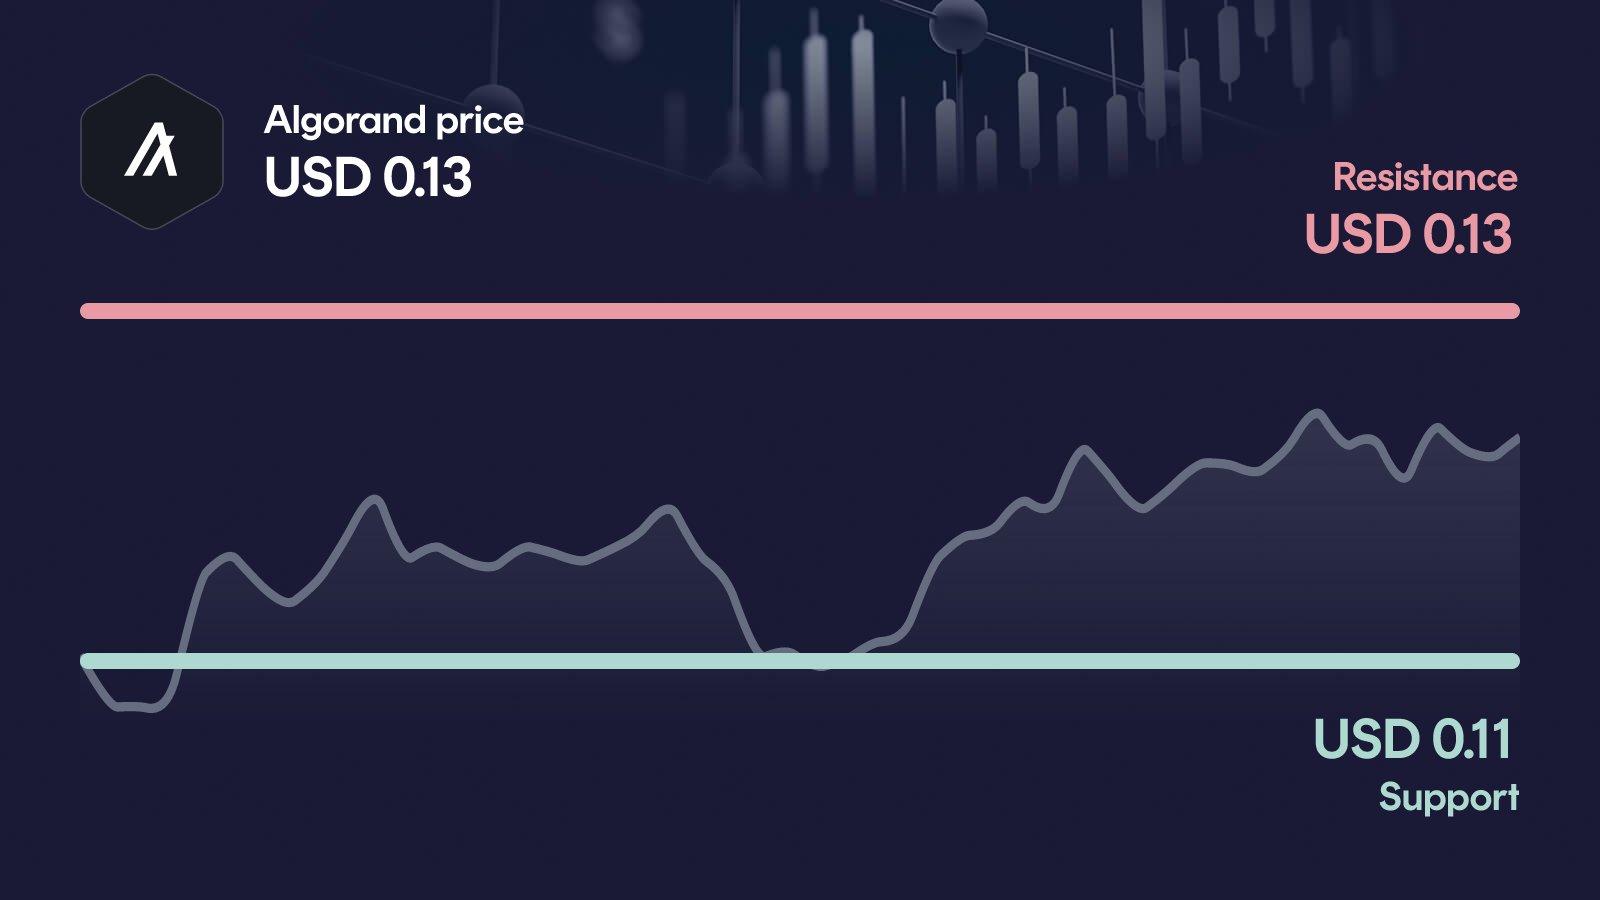
The immediate resistance now sits at $0.135, only a whisker above the current price; a clean daily close above would confirm the breakout and open the path toward fresh multi-month highs. Support has shifted higher to $0.105, the level bulls need to defend to keep the short-term structure intact. If that zone gives way, the next relevant reference is the secondary support at $0.0923, close to the 50-day moving average.
Algorand indicators: RSI, MACD and volume
The three indicators currently paint a consistent, strongly bullish picture, with one caveat. RSI at 69 sits right on the edge of overbought territory, reflecting powerful momentum but also warning that short-term exhaustion could set in. MACD is bullish at 0.0064, with a histogram that has expanded steadily over the last week, confirming that trend strength is building rather than fading. Volume is running 349% above the 30-day average, an unambiguous sign that real capital is behind this move, not just thin-market noise. Taken together, momentum, trend and participation all lean bullish, though the elevated RSI means the next few sessions will show whether buyers can absorb profit-taking.
Relative Strength Index
MACD
AI forecast for Algorand
Looking toward year-end 2026, our AI forecast model places Algorand in a range between $0.1225 and $0.2231. The central expected value sits around $0.1653, but this is not a price target: it is the midpoint of a broad probability distribution that reflects how wide the possible outcomes remain.
The width of that range matters more than any single number. In the conservative case, ALGO would trade roughly 10% below current levels, while the optimistic scenario implies about 64% upside. That asymmetry mirrors what the chart currently shows: strong momentum with room higher, but no guarantee the breakout holds without a healthy consolidation first.
What could happen now?
Bullish scenario
A daily close above $0.135 with volume staying elevated would confirm the breakout and put the next orientation zone in reach. The short-term setup would strengthen further as long as MACD keeps expanding and RSI does not push deep into overbought territory above 75. Volume needs to remain well above average to validate that real demand, not just short-covering, is driving the move. To keep the bullish structure intact on any pullback, ALGO should not lose the reclaimed $0.127 zone on a closing basis.
Trigger: > $0.135 with elevated volume
Bearish scenario
If ALGO fails at $0.135 and slips back below $0.105, the breakout narrative would quickly lose credibility. The short-term setup would weaken as RSI rolls over from overbought and the MACD histogram starts to compress. The next reference on the downside would be the secondary support at $0.0923, near the 50-day moving average. A break of that level would put the medium-term trend under real pressure and expose the $0.0837 monthly low as the next orientation.
Trigger: < $0.105
Conclusion: Decision at $0.135
The technical setup is constructive, but the elevated RSI means the market is running hot. The decisive area is the $0.127 to $0.135 zone, where bulls need to confirm the breakout with a clean daily close.
A sustained move above $0.135 on continued high volume would open the next leg higher and validate the strong 30- and 60-day performance. A rejection and slide back under $0.105 would flip the picture and put the 50-day average back in play as the next test. The next few trading days are likely to set the direction.
Want to buy Algorand? Kraken is our recommended crypto trading platform.
Continue to KrakenSince 2017, Philipp Duringer has been deeply involved in Bitcoin, crypto assets and digital financial markets. As the founder of Coinbird, he combines years of crypto experience with more than 15 years of technical experience in IT and digital products. His goal is to make crypto easier to understand, more transparent and easier to compare.
About the authorAI-assisted: This price analysis is generated automatically based on structured market data and reviewed through defined quality rules. It is for informational purposes only and is not financial or investment advice or a recommendation to buy or sell crypto assets.