Solana is rebounding sharply and pressing against the key resistance near $82.40, the current weekly high. Momentum is clearly improving, but the breakout has not been confirmed yet. If the price clears this zone, the recovery could gain significantly more traction.
Key takeaways in a nutshell
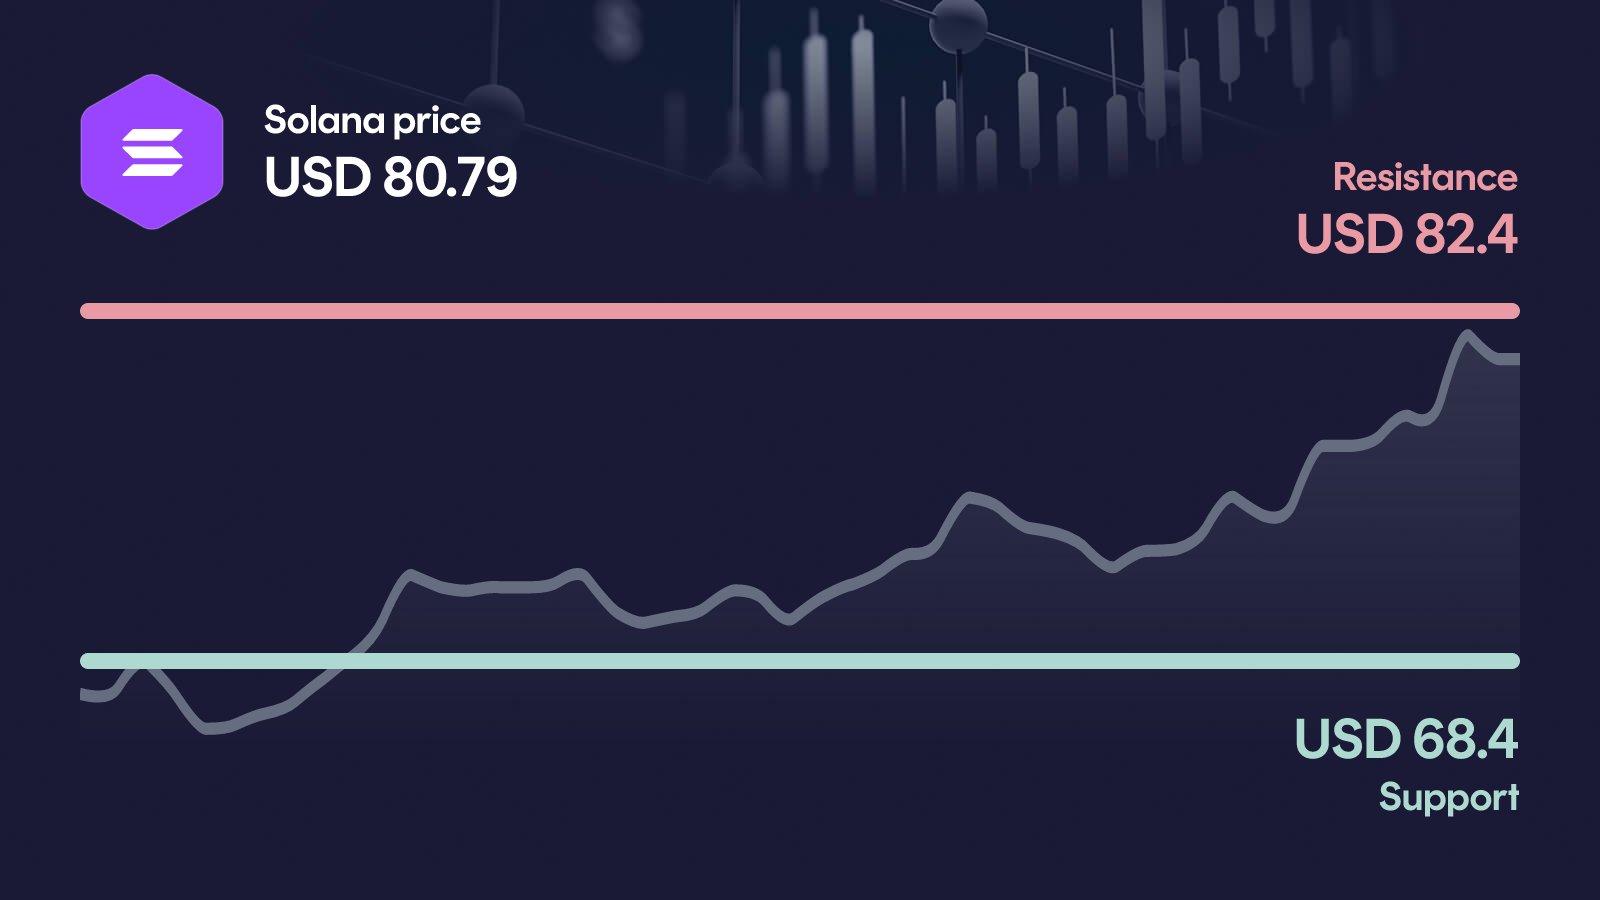
Recovery gains traction: SOL trades near $80.79 after a 14.4% gain over the past 7 days.
Trend still split: Price sits above the 50-day average at $76, but clearly below the 200-day at $94.30.
Breakout in focus: Above $82.40, the setup would improve significantly and open the path toward $87.40.
Momentum turns constructive: RSI at 59 and a bullish MACD signal support the ongoing recovery attempt.
AI sees upside room: The forecast model places SOL between $81 and $122 by year-end 2026.
What happened to the Solana price?
Solana is trading at $80.79 and has clearly picked up speed: over the past 7 days, SOL gained 14.4%, and the monthly performance is now positive again at +7.4%. The weekly high at $82.40 also marks the monthly high, which shows how directly the current move is pushing against the upper edge of the range.
The most notable signal is volume: 24h turnover of $3.61 billion sits about 17% above the 30-day average. That is not an explosive spike, but it confirms that the rebound is being carried by real activity, not just a quiet drift higher.
Key price levels for Solana
These are the key zones now: the resistance at $82.40 is the decisive hurdle, and a clean move above it would open the path toward the next area near $87.40. On the downside, the zone around $68.40 acts as primary support and defines the floor of the current recovery. If Solana loses that level, the next relevant reference sits near $59.50, which would put the whole rebound into question.
Solana indicators: RSI, MACD and volume
The three indicators currently paint a fairly consistent picture. The RSI at 59 shows solid momentum without moving into overbought territory, leaving room for further upside. The MACD signal is bullish, and the histogram has turned back up in recent readings, which confirms that the short-term trend has regained strength. Volume sits about 17% above the 30-day average, still classified as average, but clearly supportive of the current push. Taken together, momentum, trend signal and participation align on the constructive side, without yet screaming breakout confirmation.
Relative Strength Index
MACD
AI forecast for Solana
Looking toward year-end 2026, our AI forecast model places Solana in a wide range between $81.45 and $121.51. The central expected value sits at $99.48, but this figure is not a price target, it is the midpoint of a broad probability distribution.
That distinction matters, because the range says more about the setup than a single number could. In the conservative case, SOL would be roughly 0.6% above today's level, essentially flat, while the optimistic case would imply an upside of about 50%. This asymmetry between limited downside and clear upside potential is the more interesting message of the model, especially with price still trading well below the 200-day average.
What could happen now?
Bullish scenario
If Solana closes decisively above $82.40 with continued elevated volume, the breakout would no longer look like a short-term impulse but would be much better supported. The next reference would then be the area around $87.40, followed by the 200-day average near $94.30 as the bigger medium-term hurdle. For that path to stay intact, the RSI should not overheat too quickly and the MACD histogram needs to keep building. On any pullback, the reclaimed $82 zone should hold to confirm the shift.
Trigger: > $82.40 with elevated volume
Bearish scenario
If SOL fails once again at the $82.40 resistance and slips back toward the primary support at $68.40, the recovery attempt would quickly lose credibility. A break below that zone would open the way toward the next reference near $59.50, which sits close to the monthly low. In that case, the MACD would likely lose its bullish signal, and volume would need to be watched closely for signs of capitulation. Below $59.50, the medium-term trend, still defined by the 200-day average at $94.30, would come under renewed pressure.
Trigger: < $68.40
Conclusion: Decision at $82.40
The technical setup is constructive, but not yet confirmed: momentum, trend signal and volume align on the bullish side, while the price is still capped by the weekly high. The decisive area is the $82.40 resistance, which acts as the gatekeeper for the next leg.
A clean breakout would open the path toward $87.40 and, further out, the 200-day average near $94.30. A rejection followed by a slide below $68.40 would push the focus back down to $59.50 and put the entire recovery into question. The next few trading days are likely to set the direction.
Want to buy Solana? Kraken is our recommended crypto trading platform.
Continue to KrakenSince 2017, Philipp Duringer has been deeply involved in Bitcoin, crypto assets and digital financial markets. As the founder of Coinbird, he combines years of crypto experience with more than 15 years of technical experience in IT and digital products. His goal is to make crypto easier to understand, more transparent and easier to compare.
About the authorAI-assisted: This price analysis is generated automatically based on structured market data and reviewed through defined quality rules. It is for informational purposes only and is not financial or investment advice or a recommendation to buy or sell crypto assets.