
This Ethereum price analysis was published on and is not the latest edition.
Ethereum is rebounding and approaching the key resistance area near $1,890 after gaining over 8% in a week. The MACD has flipped bullish, but price still trades far below the 50- and 200-day averages. If buyers fail at this zone, the recovery could quickly lose steam again.
Key takeaways in a nutshell
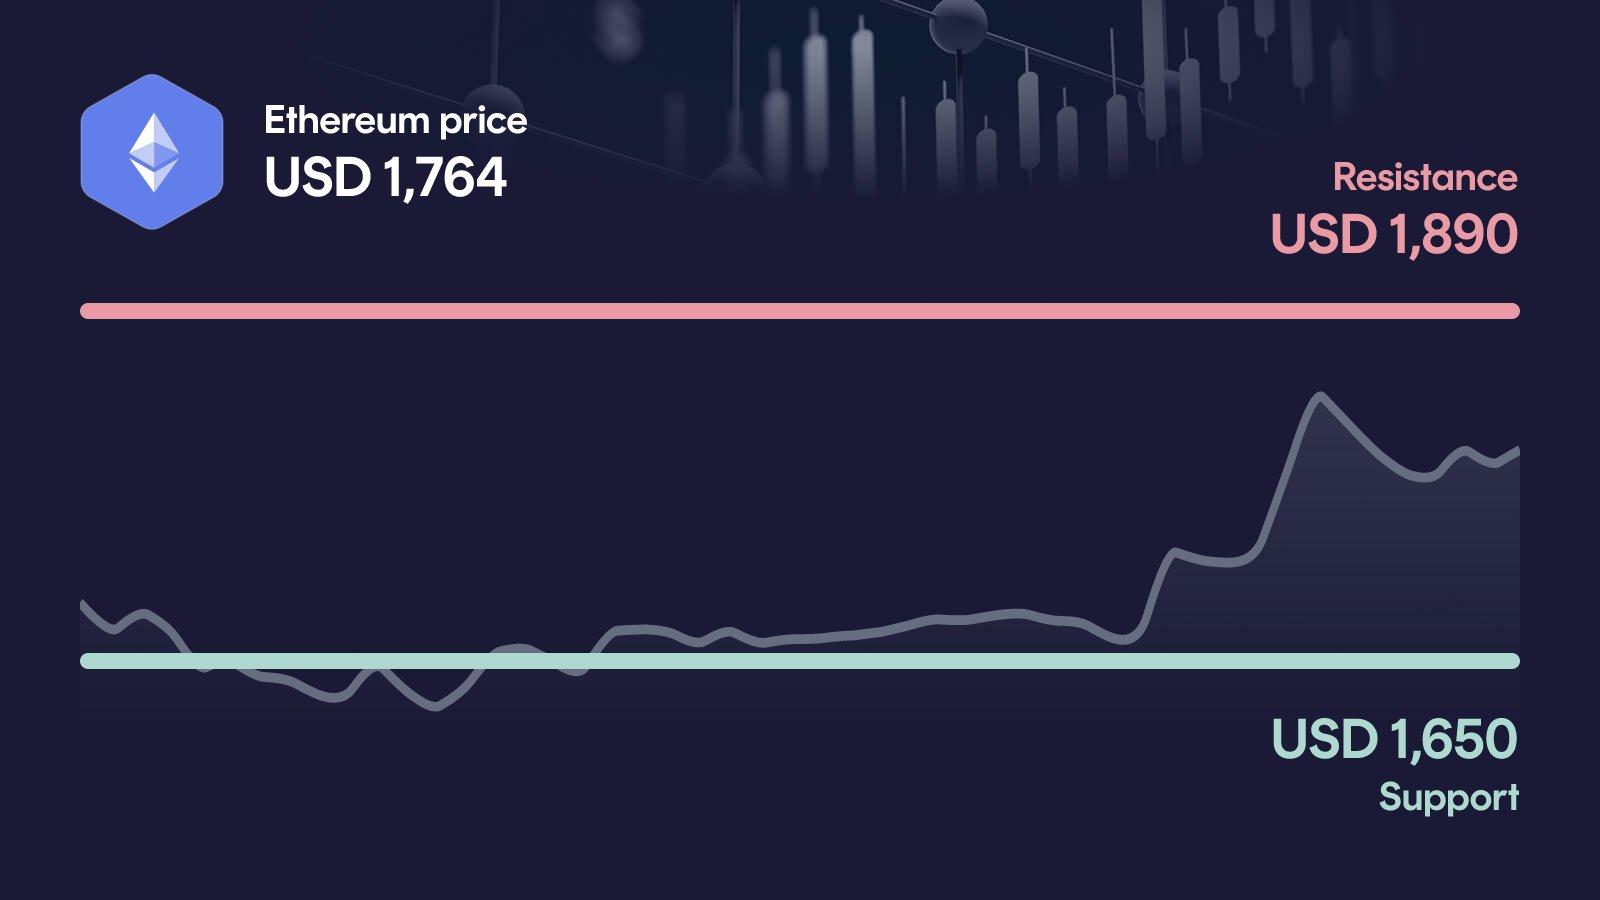
Recovery in motion: ETH trades at $1,764 after an 8.2% weekly rebound from deep lows.
Trend still bearish: Price remains 14% below the 50-day and 26% below the 200-day average.
Breakout in focus: Above $1,890, the short-term setup would improve significantly.
Momentum turning: RSI at 45 is neutral, while the MACD has flipped bullish.
AI sees upside room: The 2026 forecast range spans $1,794 to $3,612, with a $2,676 midpoint.
What happened to the Ethereum price?
Ethereum trades at $1,764, down 2.1% over the past 24 hours but up a notable 8.2% over the week. Zoomed out, the picture stays uncomfortable: ETH is down 16.7% over 30 days and more than 41% over the past 200 days. The weekly high near $1,850 sits right under the next major resistance, where sellers have so far blocked further upside.
The most notable signal is volume: 24-hour turnover of $13.2 billion comes in roughly 12% below the 30-day average. That means the rebound is happening on average, not above-average participation, which leaves the recovery technically intact but not yet fully confirmed.
Key price levels for Ethereum
These are the key zones now: The resistance at $1,890 is the next major hurdle, and a move above it would open the path toward the secondary barrier near $1,990. On the downside, the area around $1,650 acts as support, capping the recent recovery base. If Ethereum falls below it, the next relevant level near $1,510 becomes the key reference point.
Ethereum indicators: RSI, MACD and volume
The three indicators currently paint a mixed but improving picture. The RSI sits at 45, neutral territory with room to climb before any overheating risk appears. The MACD has flipped bullish with a recent crossover, and the histogram has turned positive over the last sessions, confirming that downside momentum is fading. Volume, however, remains 12% below the 30-day average, signalling that the rebound lacks broad participation. Together, momentum is healing, but conviction is not yet strong enough to call this a confirmed trend reversal.
Relative Strength Index
MACD
AI forecast for Ethereum
Looking toward year-end 2026, our AI forecast model places Ethereum in a range between $1,794 and $3,612. The central expected value sits at $2,676, but this is not a price target, rather the midpoint of a broad probability distribution.
That spread is the actual story: the model sees only about 1.4% downside in the conservative case, while the optimistic scenario implies upside of more than 104%. The asymmetry suggests that current levels carry more potential reward than additional risk in the model's view, but the wide range also reflects how much uncertainty remains around the broader trend. A confirmed move above $1,890 would be a first technical signal that the upper half of that distribution gains weight.
What could happen now?
Bullish scenario
If Ethereum can push decisively above $1,890 with stronger volume than seen so far, the breakout would no longer look like a short-term impulse but a real shift in the short-term setup. The path toward the secondary resistance near $1,990 would then open, and a reclaim of the $2,000 area would put the 50-day average back in focus. For this to hold, the RSI should not run hot too quickly and the MACD needs to keep building positive momentum. Most importantly, ETH would need to defend the $1,650 zone on any pullback to keep the structure intact.
Trigger: > $1,890 with elevated volume
Bearish scenario
If support at $1,650 breaks, the recent strength would lose its base and the rebound risks turning into another lower high. The next reference would be the $1,510 area, which also marked the 30-day low. A break below that would put significantly more pressure on the medium-term trend and reopen the door to deeper levels. With price still well below both the 50- and 200-day averages, sellers retain the structural edge as long as $1,890 stays unbroken.
Trigger: < $1,650
Conclusion: Decision at $1,890
The technical setup is mixed but improving, with momentum turning while the broader trend remains clearly bearish. The decisive area is the $1,650 to $1,890 range, which now defines the short-term battlefield.
A confirmed move above $1,890 with stronger volume would mark the first real crack in the downtrend and open room toward $1,990 and beyond. A break below $1,650, however, would quickly invalidate the recovery and bring $1,510 back into play. The next few trading days are likely to set the direction.
Want to buy Ethereum? Kraken is our recommended crypto trading platform.
Continue to KrakenSince 2017, Philipp Duringer has been deeply involved in Bitcoin, crypto assets and digital financial markets. As the founder of Coinbird, he combines years of crypto experience with more than 15 years of technical experience in IT and digital products. His goal is to make crypto easier to understand, more transparent and easier to compare.
About the authorAI-assisted: This price analysis is generated automatically based on structured market data and reviewed through defined quality rules. It is for informational purposes only and is not financial or investment advice or a recommendation to buy or sell crypto assets.