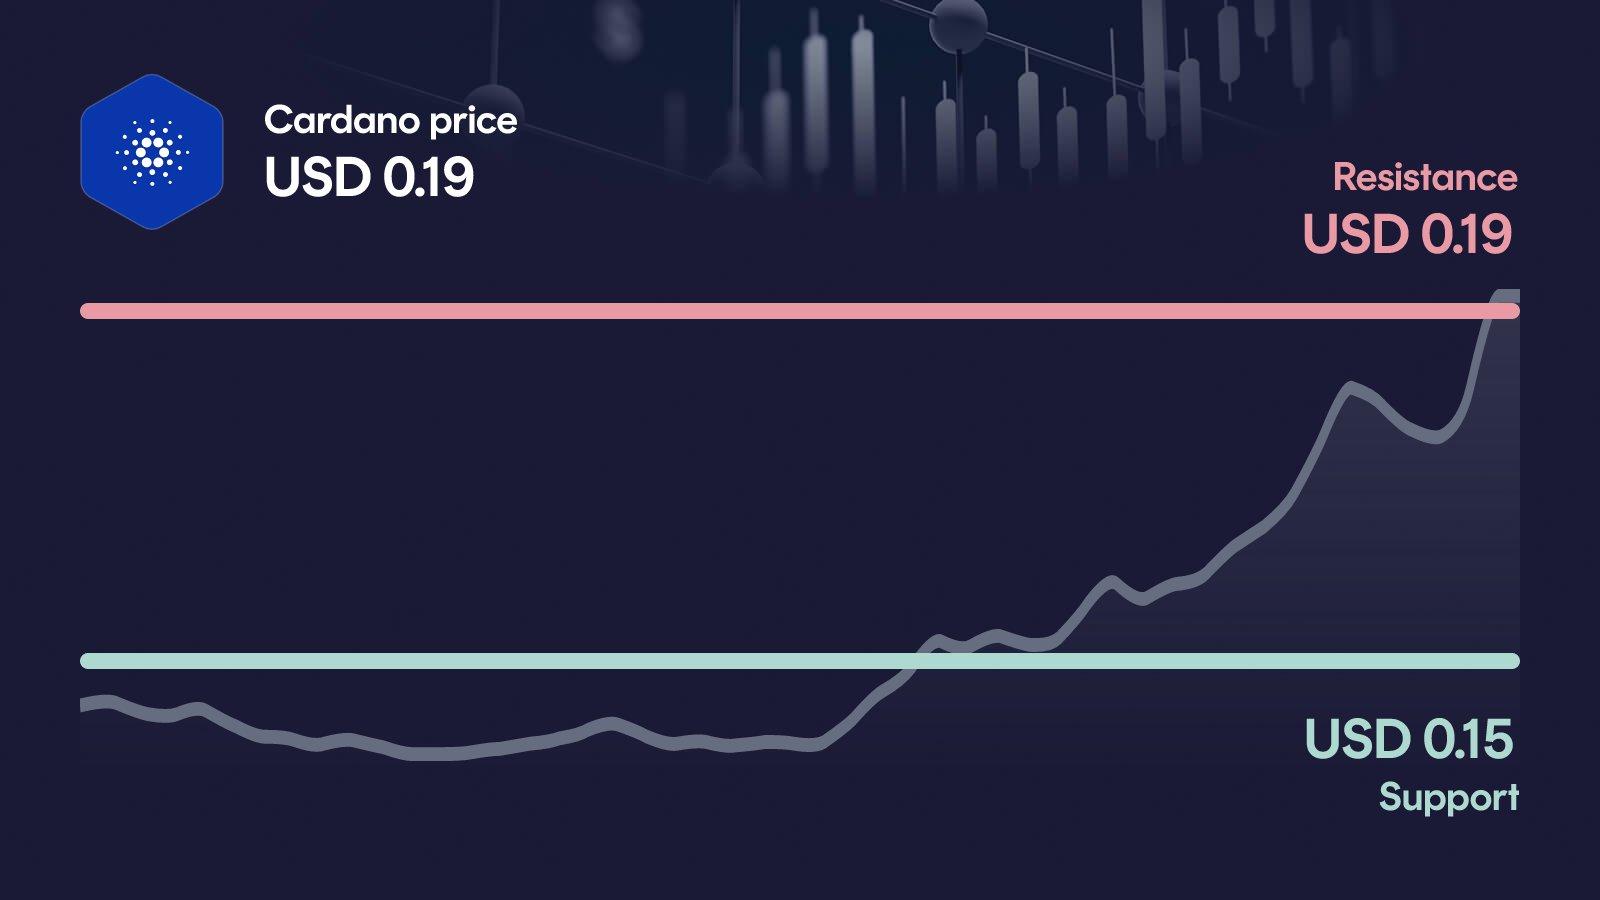
Cardano is rebounding sharply and pushing straight into the key resistance near $0.194. Volume is running well above average, and momentum has flipped bullish, but the breakout is not yet confirmed. If ADA clears this zone, the recovery could gain real traction; if it fails here, the move risks turning into a fake-out.
Key takeaways in a nutshell
Strong weekly rebound: Cardano trades at $0.1917, up more than 32% over the past 7 days.
Trend still fragile: Price sits right at the 50-day MA ($0.193) but remains 29% below the 200-day MA ($0.27).
Breakout in focus: The zone around $0.194 is the decisive resistance; above it, $0.209 comes into play.
Momentum turns constructive: RSI at 59 and a bullish MACD signal back the rebound without showing overheating.
AI sees wide range: The AI model places the 2026 range between $0.22 and $0.61, with a midpoint near $0.37.
What happened to the Cardano price?
Cardano is trading at $0.1917, up 8.9% in the last 24 hours and an impressive 32.3% over the past week. On a 30-day basis, ADA is also up 16.6%, and the weekly high at $0.199 sits just above the current level, meaning price is pushing directly against short-term resistance.
The most notable signal is volume: 24h turnover of roughly $816 million is running around 71% above the 30-day average, well into above-average territory. That kind of participation on a strong up-move suggests the rebound has real buying behind it, not just a thin bounce off the lows near $0.142.
Key price levels for Cardano
These are the key zones now: The resistance at $0.194 is the immediate hurdle, and a clean move above it would open the path toward the next orientation level near $0.201 and the secondary resistance at $0.209. On the downside, the area around $0.154 acts as primary support, marking the base from which this rebound started. If Cardano loses that zone, the next relevant reference sits near $0.139, the recent 30-day low.
Cardano indicators: RSI, MACD and volume
The three indicators currently paint a consistent picture. The RSI at 59 sits in the upper neutral zone: firm enough to reflect real momentum, but still clearly below the overbought threshold at 70. The MACD is signaling bullish, and the rising histogram confirms that upward pressure has been building rather than fading. Volume at around 71% above the 30-day average underlines that the move is broadly supported. Taken together, the setup leans constructive, though the fact that price is fighting directly at resistance keeps the picture short-term sensitive.
Relative Strength Index
MACD
AI forecast for Cardano
Looking toward year-end 2026, our AI forecast model places Cardano in a wide range between $0.223 and $0.607. The central expected value sits near $0.368, but this is not a price target: it is the midpoint of a broad probability distribution, not a promise about where ADA will actually trade.
What matters more than that single number is the shape of the range itself. In the conservative case, the model still implies an upside of roughly +15.8% from the current level, while the optimistic case corresponds to about +214.7%. That asymmetry is typical for an asset like Cardano that has already lost about 94% from its all-time high: the upside range is wide, but so is the uncertainty around it.
What could happen now?
Bullish scenario
A confirmed daily close above $0.194 on continued strong volume would clearly improve the short-term setup. In that case, the next orientation level near $0.201 and the secondary resistance at $0.209 would come into focus. For the move to remain healthy, the RSI should not shoot deep into overbought territory, and the MACD histogram would need to keep expanding. As long as pullbacks hold above the $0.154 support zone, the constructive picture would stay intact.
Trigger: > $0.194 with elevated volume
Bearish scenario
If Cardano fails at the $0.194 resistance and later slips back below $0.154, the current strength would quickly lose credibility. In that case, the recent 30-day low near $0.139 becomes the next relevant reference, followed by the secondary support around $0.127. A break of that zone would put additional pressure on the medium-term trend, which is already fragile with price 29% below the 200-day MA. The rebound would then look more like a countertrend move than the start of a genuine turnaround.
Trigger: < $0.154
Conclusion: Decision at $0.194
The technical setup is constructive in the short term, but the broader trend remains weak with price still deep below the 200-day average. The decisive area is the resistance zone around $0.194, right where ADA is trading now.
A clean breakout on strong volume would open the path toward $0.201 and $0.209 and turn the rebound into something more sustainable. A rejection here, followed by a loss of the $0.154 support, would expose $0.139 and re-open the downside. The next few trading days are likely to set the direction.
Want to buy Cardano? Kraken is our recommended crypto trading platform.
Continue to KrakenSince 2017, Philipp Duringer has been deeply involved in Bitcoin, crypto assets and digital financial markets. As the founder of Coinbird, he combines years of crypto experience with more than 15 years of technical experience in IT and digital products. His goal is to make crypto easier to understand, more transparent and easier to compare.
About the authorAI-assisted: This price analysis is generated automatically based on structured market data and reviewed through defined quality rules. It is for informational purposes only and is not financial or investment advice or a recommendation to buy or sell crypto assets.