This Cardano price analysis was published on and is not the latest edition.
Cardano is under pressure and approaching the critical support zone near $0.155. The RSI has dropped to 32, volume remains well below average, and buyers have shown little conviction over the past weeks. If this support breaks, the correction could accelerate toward the next downside reference.
Key takeaways in a nutshell
Pressure intensifies: ADA trades at $0.1603, down 4.7% on the week and 35.6% over 30 days.
Trend clearly broken: Price sits 29% below the 50-day and 45% below the 200-day moving average.
Support must hold: The $0.155 zone is the last line of defense before $0.149 comes into focus.
Momentum weak: RSI at 32 signals oversold conditions, but no reversal confirmation yet.
AI sees recovery room: The model places ADA between $0.223 and $0.607 by year-end 2026.
What happened to the Cardano price?
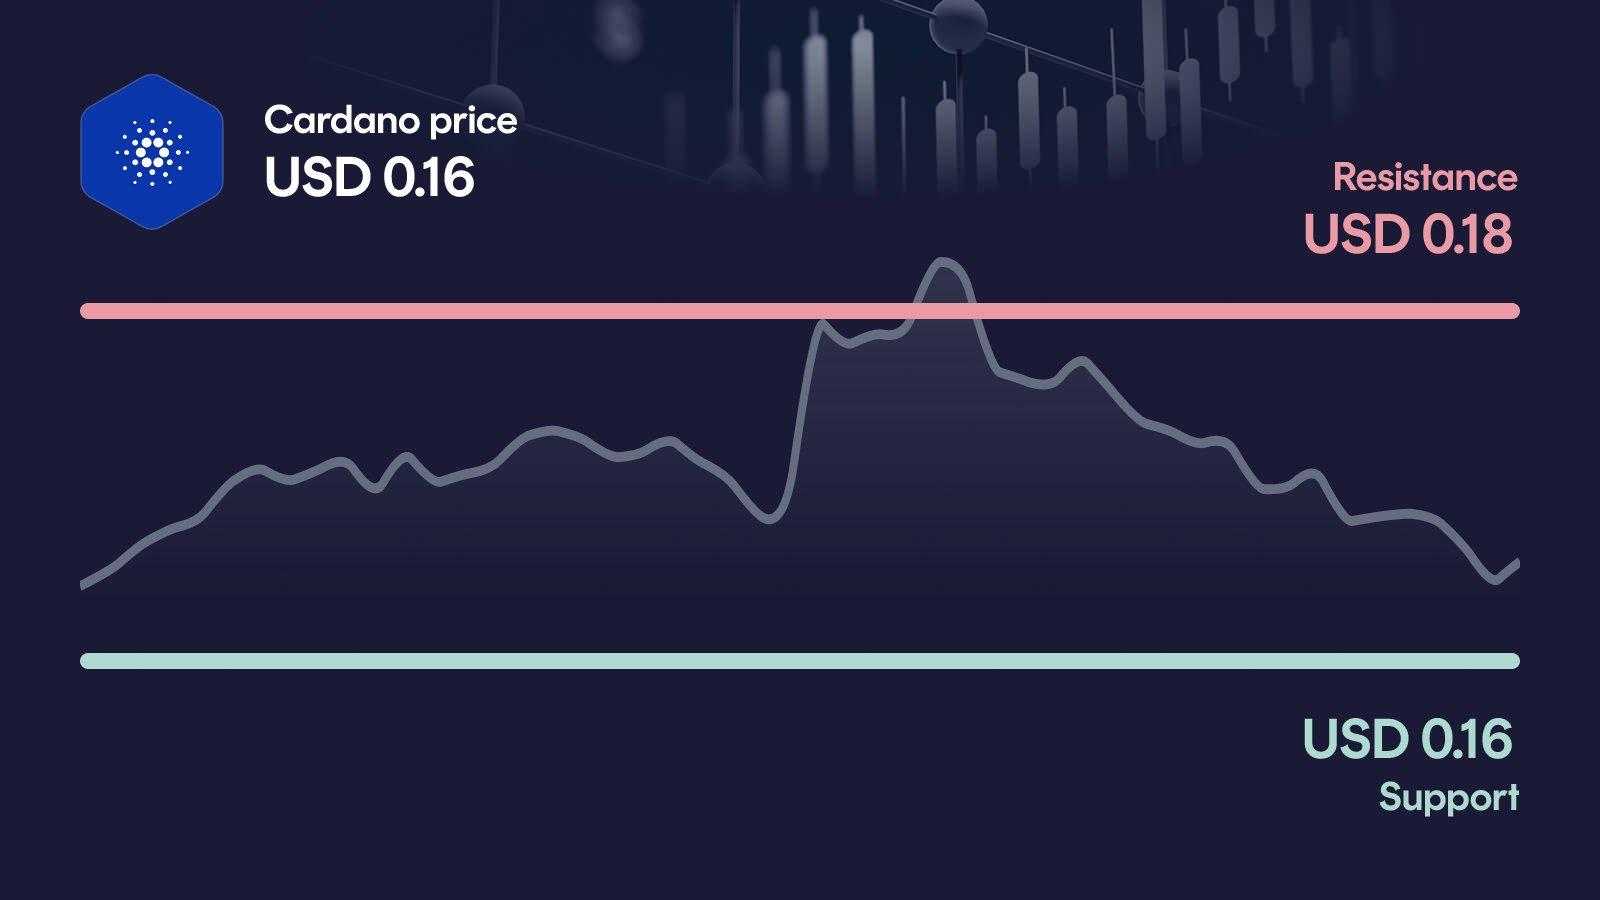
Cardano is trading at $0.1603, down 3.8% in 24 hours and 4.7% over the past week. The 30-day picture is far more brutal: a loss of 35.6%, with the price sitting just above the monthly low of $0.149 and far below the weekly high of $0.189.
The most telling signal comes from volume: at $375 million in 24 hours, turnover is 23.8% below the 30-day average. That means the sell-off is happening on weak participation, which makes the lack of buying interest the real story here, not a sudden panic move.
Key price levels for Cardano
These are the key zones now: The resistance at $0.184 marks the first major hurdle, and only a clean reclaim would put bulls back in the conversation. On the downside, the area around $0.155 acts as the decisive support. If Cardano slips below it, the next relevant reference at $0.149 becomes the focal point, with secondary support at $0.144 right behind.
Cardano indicators: RSI, MACD and volume
The three indicators currently paint a mixed but cautious picture. The RSI at 32 sits at the edge of oversold territory, which signals stretched conditions but no confirmed reversal. The MACD has just turned bullish on the histogram after weeks in negative territory, which hints at fading bearish momentum rather than fresh strength. Volume is 23.8% below the 30-day average, meaning conviction is absent on both sides. Together, the picture suggests a market that is exhausted to the downside, yet still lacks the buying pressure needed for a real turnaround.
Relative Strength Index
MACD
AI forecast for Cardano
Looking toward year-end 2026, our AI forecast model places Cardano in a wide range between $0.223 and $0.607. The central expected value sits at $0.368, but this is not a price target, it is the midpoint of a broad probability distribution that reflects the high uncertainty in the current setup.
The range matters far more than the single midpoint, because it captures both the recovery potential and the downside risk that traders need to weigh. In the conservative case, that would mean an upside of around +39.1% from today's level, while the optimistic case implies roughly +278.2%. Such a wide spread underlines that the model sees room for recovery, but no certainty about the path.
What could happen now?
Bullish scenario
For a bullish turn, Cardano would need to reclaim the $0.184 resistance on clearly rising volume. That would shift the short-term setup from defense to recovery and open the door toward the secondary resistance at $0.201. The RSI should ideally rise out of oversold territory without immediately overheating, and the MACD would need to confirm its tentative bullish shift with stronger histogram readings. Crucially, the $0.155 zone should not be tested again to keep the recovery intact.
Trigger: > $0.184 with elevated volume
Bearish scenario
The bearish case activates if Cardano loses the $0.155 support on a daily close. That would invalidate the oversold bounce thesis and bring the $0.149 monthly low into immediate focus, with secondary support at $0.144 right behind. Volume would likely pick up on a break, accelerating the move, while the already weak position below both the 50-day and 200-day moving averages would put further pressure on the medium-term trend. A sustained move below $0.144 would deepen the downtrend significantly.
Trigger: < $0.155
Conclusion: $0.155 support decides the direction
The technical setup is fragile, but oversold conditions and a turning MACD histogram suggest the selling pressure may be easing. The decisive area is the $0.155 support zone, which now separates a possible stabilization from a deeper leg lower.
If this level holds and ADA manages to reclaim $0.184, the door opens for a relief move with room toward $0.201. If $0.155 breaks, the focus shifts quickly to $0.149 and then $0.144, where the medium-term trend would come under even more pressure. With volume well below average and no clear buying interest yet, the burden of proof remains on the bulls. The next few trading days are likely to set the direction.
Want to buy Cardano? Kraken is our recommended crypto trading platform.
Continue to KrakenSince 2017, Philipp Duringer has been deeply involved in Bitcoin, crypto assets and digital financial markets. As the founder of Coinbird, he combines years of crypto experience with more than 15 years of technical experience in IT and digital products. His goal is to make crypto easier to understand, more transparent and easier to compare.
About the authorAI-assisted: This price analysis is generated automatically based on structured market data and reviewed through defined quality rules. It is for informational purposes only and is not financial or investment advice or a recommendation to buy or sell crypto assets.