
Bonk is under heavy pressure, losing nearly 29% over the past week and trading close to its monthly low. The RSI has dropped into oversold territory, while MACD remains firmly bearish and volume is running well above the 30-day average, a sign that sellers are still active. Now the market has to show whether this washout attracts fresh demand or whether the next leg down begins.
Key takeaways in a nutshell
Sharp weekly sell-off: Bonk trades near $0.0000030, down roughly 29% in seven days and 36% in a month.
Trend clearly broken: The price sits about 70% below its 200-day moving average, confirming a dominant downtrend.
Oversold, but fragile: RSI at 27 signals extreme weakness, yet no reversal signal has been confirmed.
Sellers stay active: Volume runs 59% above the 30-day average, showing that distribution is still ongoing.
AI sees wide range: By year-end 2026, the AI model projects a range between $0.0000041 and $0.0000101.
What happened to the Bonk price?
Bonk is trading near $0.0000030, extending a heavy sell-off that has erased around 28.6% in just seven days and 36% over the past month. On a 60-day basis, the token is down more than 52%, and the yearly performance sits at a brutal -91.6%, leaving BONK about 95% below its all-time high near $0.00006.
The most notable signal is volume: at over $61 million in 24 hours, turnover is running 59% above the 30-day average. That is not the profile of a quiet drift lower, but of active selling pressure meeting forced exits, and it explains why the recent breakdown has been so aggressive.
Key price levels for Bonk
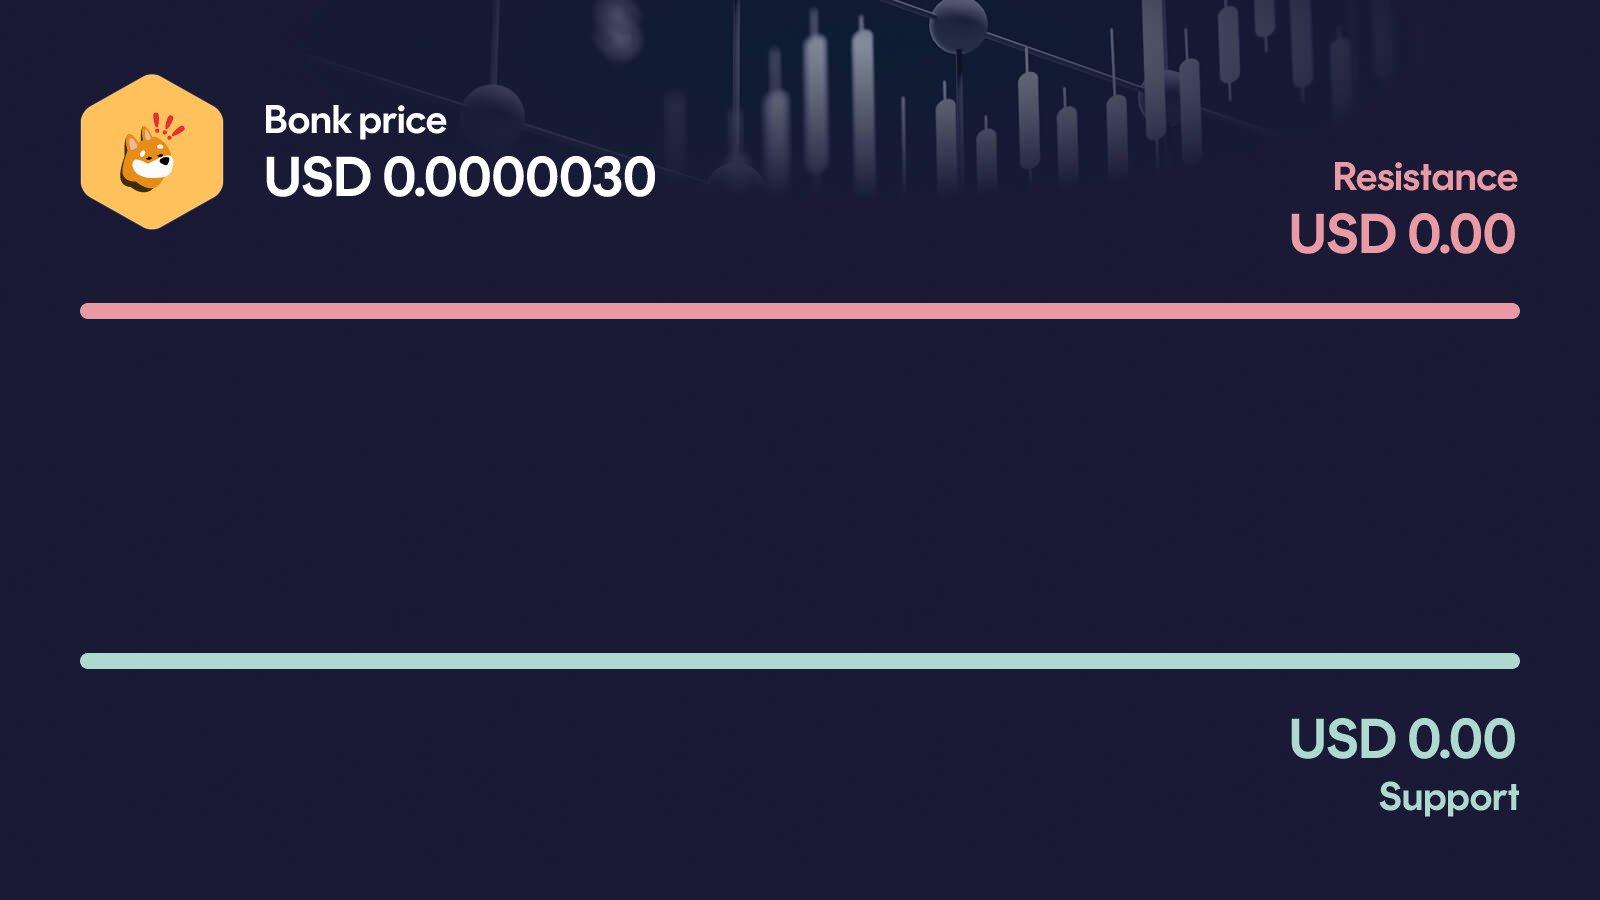
These are the key zones now: the monthly high near $0.00001 stands as the major overhead resistance, and only a reclaim of that level would seriously challenge the bearish structure. On the downside, the current area around $0.0000030 is acting as the last visible support, coinciding with the recent low. If Bonk loses this zone, the 200-day moving average region near $0.00001 flips from potential magnet to distant reference, and price would enter open territory with little historical footing to lean on.
Bonk indicators: RSI, MACD and volume
The three indicators currently paint a consistent, decidedly bearish picture. The RSI at 27 sits clearly in oversold territory, which reflects the intensity of the sell-off but is not, on its own, a reversal signal. MACD remains bearish with a negative value and a histogram that has been sliding deeper into negative territory over recent sessions, confirming that downside momentum is still building rather than fading. Volume is running 59% above the 30-day average, which underlines that the move is being driven by real selling flow, not thin liquidity. Taken together, the setup suggests that Bonk is stretched to the downside, but without a clear stabilization signal, oversold conditions can persist longer than expected.
Relative Strength Index
MACD
AI forecast for Bonk
Looking toward year-end 2026, our AI forecast model places Bonk in a wide corridor between $0.00000411 on the conservative side and $0.0000101 on the optimistic side. The central expected value comes in at around $0.00000613, but this figure should not be read as a price target: it is simply the midpoint of a broad probability distribution around a highly volatile asset.
Given how stretched the current downtrend is, the width of that range matters far more than the midpoint. Even the conservative scenario implies a recovery of roughly +44.7% from current levels, while the optimistic case sketches an upside of about +256.3%. That spread underlines how sensitive Bonk remains to shifts in sentiment and liquidity, and why any single point estimate would understate the real risk on both sides.
What could happen now?
Bullish scenario
For any bullish case to form, Bonk first needs to defend the current zone around $0.0000030 and produce a visible reaction from buyers. A gradual recovery of the MACD histogram, combined with the RSI climbing back out of oversold territory, would suggest that selling pressure is starting to fade. From there, a push back toward the monthly high near $0.00001 would become the first meaningful test of trend recovery. Volume should ideally normalize rather than spike on further selling, and the $0.0000030 area should not be lost again on a daily basis. Only above the $0.00001 region would the broader downtrend structure be seriously questioned.
Trigger: reclaim of $0.0000030 support with stabilizing volume and a MACD recovery
Bearish scenario
The bearish scenario is the path of least resistance as long as $0.0000030 does not stabilize. A clean break below this area would confirm that even oversold conditions are not enough to attract sustained buying, and the MACD trajectory suggests momentum is still expanding to the downside. In that case, Bonk would enter territory with little visible support, and price discovery could accelerate quickly given the elevated volume backdrop. The distance to the 200-day moving average near $0.00001 would then widen further, keeping the medium-term trend firmly under pressure and making any recovery attempts increasingly difficult.
Trigger: sustained break below $0.0000030 on continued high volume
Conclusion: $0.0000030 support decides the direction
The technical setup is clearly weak, but the extreme RSI reading and stretched drawdown mean a short-term reaction cannot be ruled out. The decisive area is the support zone around $0.0000030, which now serves as the last visible line before open downside.
If buyers manage to defend this level and push Bonk back toward the $0.00001 region, the aggressive sell-off could at least pause and give the market room to reset. If the zone breaks on continued high volume, the trend would extend further and the pressure on any medium-term recovery would grow. The next few trading days are likely to set the direction.
Want to buy Bonk? Kraken is our recommended crypto trading platform.
Continue to KrakenSince 2017, Philipp Duringer has been deeply involved in Bitcoin, crypto assets and digital financial markets. As the founder of Coinbird, he combines years of crypto experience with more than 15 years of technical experience in IT and digital products. His goal is to make crypto easier to understand, more transparent and easier to compare.
About the authorAI-assisted: This price analysis is generated automatically based on structured market data and reviewed through defined quality rules. It is for informational purposes only and is not financial or investment advice or a recommendation to buy or sell crypto assets.