
Bonk is under sustained pressure, losing close to 19% over the past week while trading far below its 200-day moving average. The MACD remains bearish, the RSI is drifting toward weakness, and volume offers no sign of a rescue bid. If the current zone cracks, the correction could accelerate further.
Key takeaways in a nutshell
Weekly slide deepens: Bonk trades near $0.0000040 after a 7-day loss of nearly 19% and a 30-day drop of over 8%.
Trend clearly broken: The price sits roughly 60% below the 200-day moving average, confirming a dominant downtrend.
Resistance overhead: The zone near $0.0000100 remains the decisive hurdle before any recovery narrative can restart.
Momentum fading: With RSI at 43 and a bearish MACD, sellers still control the short-term structure.
AI sees wide range: For year-end 2026, the model spans $0.0000055 to $0.0000101, a broad probability corridor rather than a target.
What happened to the Bonk price?
Bonk is trading near $0.0000040, down about 2.3% in 24 hours and roughly 19% over the past week. On a 30-day view the loss extends to over 8%, and the weekly high near $0.0000100 now looks far away. The longer-term picture is even harsher: over 60 days the token has shed more than 44%, and the one-year performance sits at around -82%.
The most notable signal is volume: 24-hour turnover of about $30.8 million is running roughly 18% below the 30-day average. That is not panic selling, but it is also not the kind of demand that turns a slide into a base. Sellers dominate quietly, and buyers are not stepping in with conviction.
Key price levels for Bonk
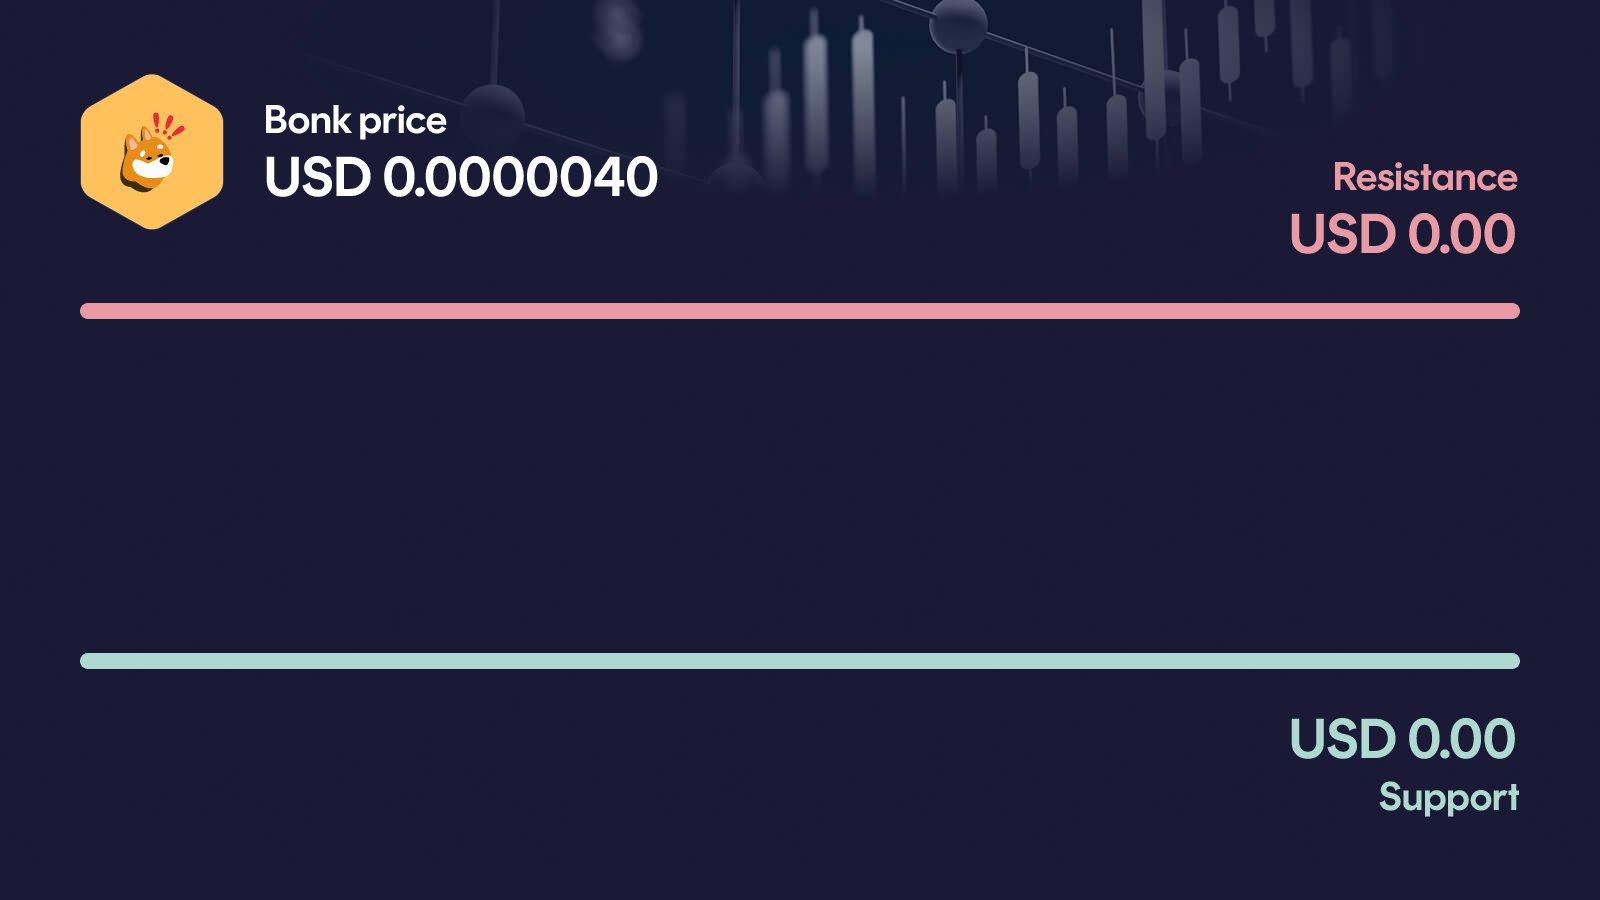
These are the key zones now: The resistance near $0.0000100 is the next major hurdle, and only a reclaim of this area would put any recovery scenario back on the table. On the downside, the current zone around $0.0000040 acts as the immediate reference point. If Bonk loses this footing, the market would be left without a clear technical anchor above the monthly lows, and downside pressure could intensify quickly.
Bonk indicators: RSI, MACD and volume
The three indicators currently paint a consistent, defensive picture. The RSI at 43 sits below the neutral line, signaling fading momentum without yet reaching oversold territory that might attract mean-reversion buyers. The MACD is bearish, with a recent bearish crossover confirming that short-term momentum has flipped against the price. Volume roughly 18% below the 30-day average shows no aggressive dip-buying, only a slow bleed. Taken together, the setup leans clearly to the downside: no oversold trigger, no bullish momentum, no volume support.
Relative Strength Index
MACD
AI forecast for Bonk
Looking toward year-end 2026, our AI forecast model places Bonk in a wide range between $0.0000055 and $0.0000101. The central expected value comes in around $0.0000075, but this is not a price target, rather the midpoint of a broad probability distribution. Given the current downtrend and the token's high volatility, the width of that range matters far more than the midpoint itself.
In the conservative case, the model implies an upside of roughly +38.7% from current levels, while the optimistic case points to about +153%. That spread reflects how uncertain the path is: even a constructive outcome would still leave Bonk well below its all-time high. For now, the technical picture has to improve before any of the higher parts of that distribution become realistic.
What could happen now?
Bullish scenario
A bullish shift would require Bonk to reclaim the resistance zone near $0.0000100 on clearly higher volume. That move would break the pattern of lower highs and force short-term sellers to reconsider. For the setup to stay credible, the RSI would need to push above the neutral line without immediately overheating, and the MACD would have to turn back into positive territory. The current zone around $0.0000040 should then not be lost again on any pullback, otherwise the recovery would quickly lose its foundation.
Trigger: > $0.0000100 with elevated volume
Bearish scenario
The bearish case is already the base case and would sharpen further if Bonk slips decisively below the $0.0000040 area. In that case, momentum would deteriorate on top of an already broken trend structure, with price sitting far under the 200-day moving average. Without a nearby technical anchor, the market would then likely search for demand closer to the monthly lows. A sustained move lower would also keep pressure on the medium-term trend, since every failed bounce reinforces the pattern of lower highs.
Trigger: < $0.0000040
Conclusion: Bonk faces a key market test
The technical setup is fragile, but not yet in full capitulation mode. The decisive area is the current zone around $0.0000040, with the $0.0000100 resistance as the far more distant recovery trigger.
If that lower zone holds and volume starts to pick up, Bonk at least has a chance to stabilize before any serious rebound attempt. If it breaks, the pullback would likely extend and the broader downtrend would gain fresh confirmation. With RSI weak, MACD bearish and volume uninspired, the burden of proof clearly lies with the buyers. The next few trading days are likely to set the direction.
Want to buy Bonk? Kraken is our recommended crypto trading platform.
Continue to KrakenSince 2017, Philipp Duringer has been deeply involved in Bitcoin, crypto assets and digital financial markets. As the founder of Coinbird, he combines years of crypto experience with more than 15 years of technical experience in IT and digital products. His goal is to make crypto easier to understand, more transparent and easier to compare.
About the authorAI-assisted: This price analysis is generated automatically based on structured market data and reviewed through defined quality rules. It is for informational purposes only and is not financial or investment advice or a recommendation to buy or sell crypto assets.