
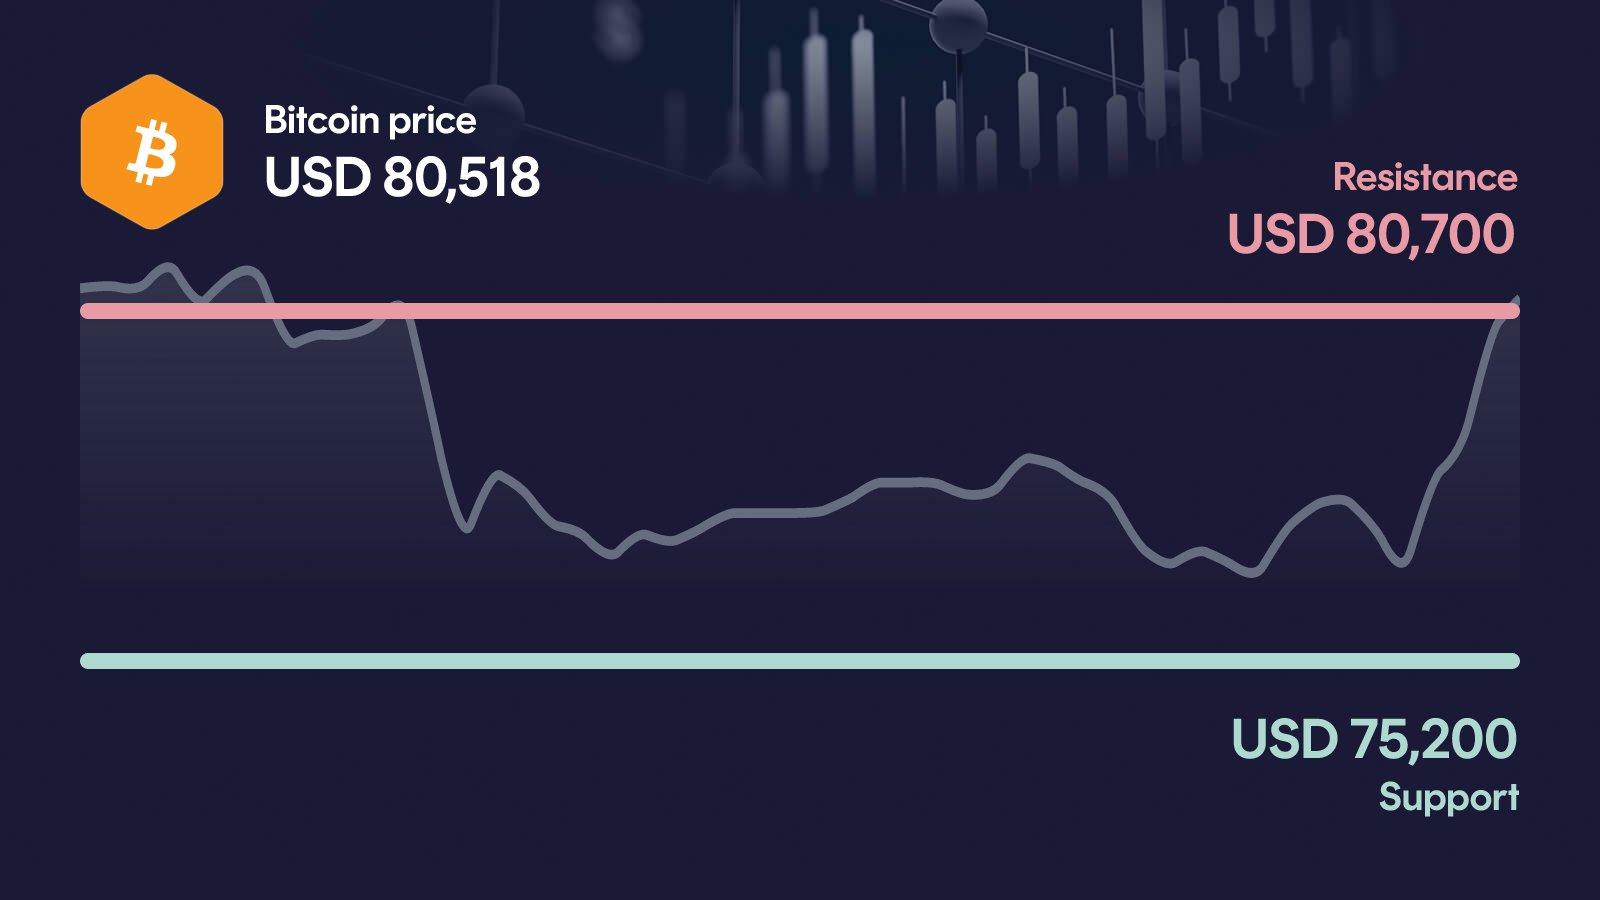
Bitcoin pushes back toward the $80,700 resistance after a sharp 5.4% intraday jump, with trading volume running 43% above the 30-day average. The 50-day moving average at $81,900 now sits directly above as the next hurdle, while RSI at 38 and a still-bearish MACD keep the setup fragile. What happens at this zone could decide whether the rebound turns into a real recovery or fades into another leg lower toward $75,200.
Key takeaways in a nutshell
Sharp intraday bounce: Bitcoin trades at $80,518 after a 5.4% jump in 24 hours, directly challenging the $80,700 resistance.
Trend under pressure: Price sits 1.7% below the 50-day average at $81,900 but holds 10% above the 200-day line at $73,200.
The decisive zone: The $80,700 resistance and the $75,200 support form the range that will determine the next directional move.
Momentum still weak: RSI at 38 shows faded momentum, and the MACD remains bearish despite the recovery attempt.
AI model sees upside: The AI forecast model projects a 2026 range between $80,822 and $133,252, with a midpoint around $103,777.
What happened to the Bitcoin price?
Bitcoin trades at $80,518 after a sharp 5.4% intraday rebound that pulled the price back to the $80,700 resistance zone. Over the past 7 days the move has been nearly flat at +0.8%, while the 30-day picture still shows a 6% decline, underlining that this bounce is happening inside a weakened structure.
The standout detail is volume: 24-hour turnover of $39.8 billion runs 43% above the 30-day average of $27.8 billion. That kind of participation gives the rebound credibility, but it also raises the stakes. If buyers cannot convert this volume into a clean break above resistance, the move risks being faded quickly.
Key price levels for Bitcoin
The first hurdle sits at $80,700, and a sustained break would open the path toward the 50-day average at $81,900 and the next orientation zone around $84,100. On the downside, $75,200 is the critical support, matching the monthly low and defining the floor of the current range. A loss of that zone would shift focus toward $72,900 as the next relevant reference below.
Bitcoin indicators: RSI, MACD and volume
The three indicators currently paint a mixed picture. RSI at 38 sits in the lower half of the neutral zone, reflecting faded momentum without being technically oversold. The MACD remains clearly bearish at -1,305, and the histogram shows no meaningful reversal yet, which weakens the case for a sustained breakout. Volume is the bright spot: at 43% above the 30-day average, participation is clearly elevated and gives the rebound real weight. Taken together, the setup looks like an early recovery attempt backed by volume but not yet confirmed by momentum.
Relative Strength Index
MACD
AI forecast for Bitcoin
Looking toward year-end 2026, our AI forecast model places Bitcoin in a wide range between $80,822 and $133,252. The central expected value sits at around $103,777, but this is not a price target: it is the midpoint of a broad probability distribution that spans very different market outcomes.
The width of the range is the key message here, as it reflects how uncertain the medium-term setup remains after the recent drawdown. In the conservative case the model sees Bitcoin essentially flat at +0.3% versus current levels, while the optimistic case implies upside of around 65.4%. That spread underlines that the current zone is more about risk management than directional conviction.
What could happen now?
Bullish scenario
A sustained move above $80,700 with volume staying elevated would mark the first real sign that buyers are regaining control. The next test would be the 50-day average at $81,900, followed by the $84,100 resistance zone. For the setup to hold, RSI would need to climb without running hot too quickly, and the MACD histogram should keep contracting toward a bullish crossover. The $75,200 support should not be revisited, otherwise the recovery narrative loses its base.
Trigger: > $80,700 with elevated volume
Bearish scenario
If Bitcoin fails at the $80,700 resistance and slides back below $75,200, the short-term setup clearly deteriorates. The bearish MACD and RSI below 40 would then align with price weakness, confirming that the rebound was a relief move rather than a trend change. The next relevant reference sits at $72,900, the secondary support. A decisive loss of that zone would put the medium-term structure under serious pressure and bring the distance to the 200-day average back into focus.
Trigger: < $75,200
Conclusion: Decision at $80,700
The technical setup is mixed, but the volume behind the current rebound makes it worth watching closely. The decisive area runs between the $80,700 resistance and the $75,200 support.
A clean break above resistance, backed by sustained volume, would open the path toward the 50-day average at $81,900 and reopen the bullish case. A rejection followed by a loss of $75,200 would instead expose $72,900 and keep the medium-term trend under pressure. With RSI low and MACD still bearish, this is a setup that rewards patience over conviction. The next few trading days are likely to set the direction.
Want to buy Bitcoin? Kraken is our recommended crypto trading platform.
Continue to KrakenSince 2017, Philipp Duringer has been deeply involved in Bitcoin, crypto assets and digital financial markets. As the founder of Coinbird, he combines years of crypto experience with more than 15 years of technical experience in IT and digital products. His goal is to make crypto easier to understand, more transparent and easier to compare.
About the authorAI-assisted: This price analysis is generated automatically based on structured market data and reviewed through defined quality rules. It is for informational purposes only and is not financial or investment advice or a recommendation to buy or sell crypto assets.