
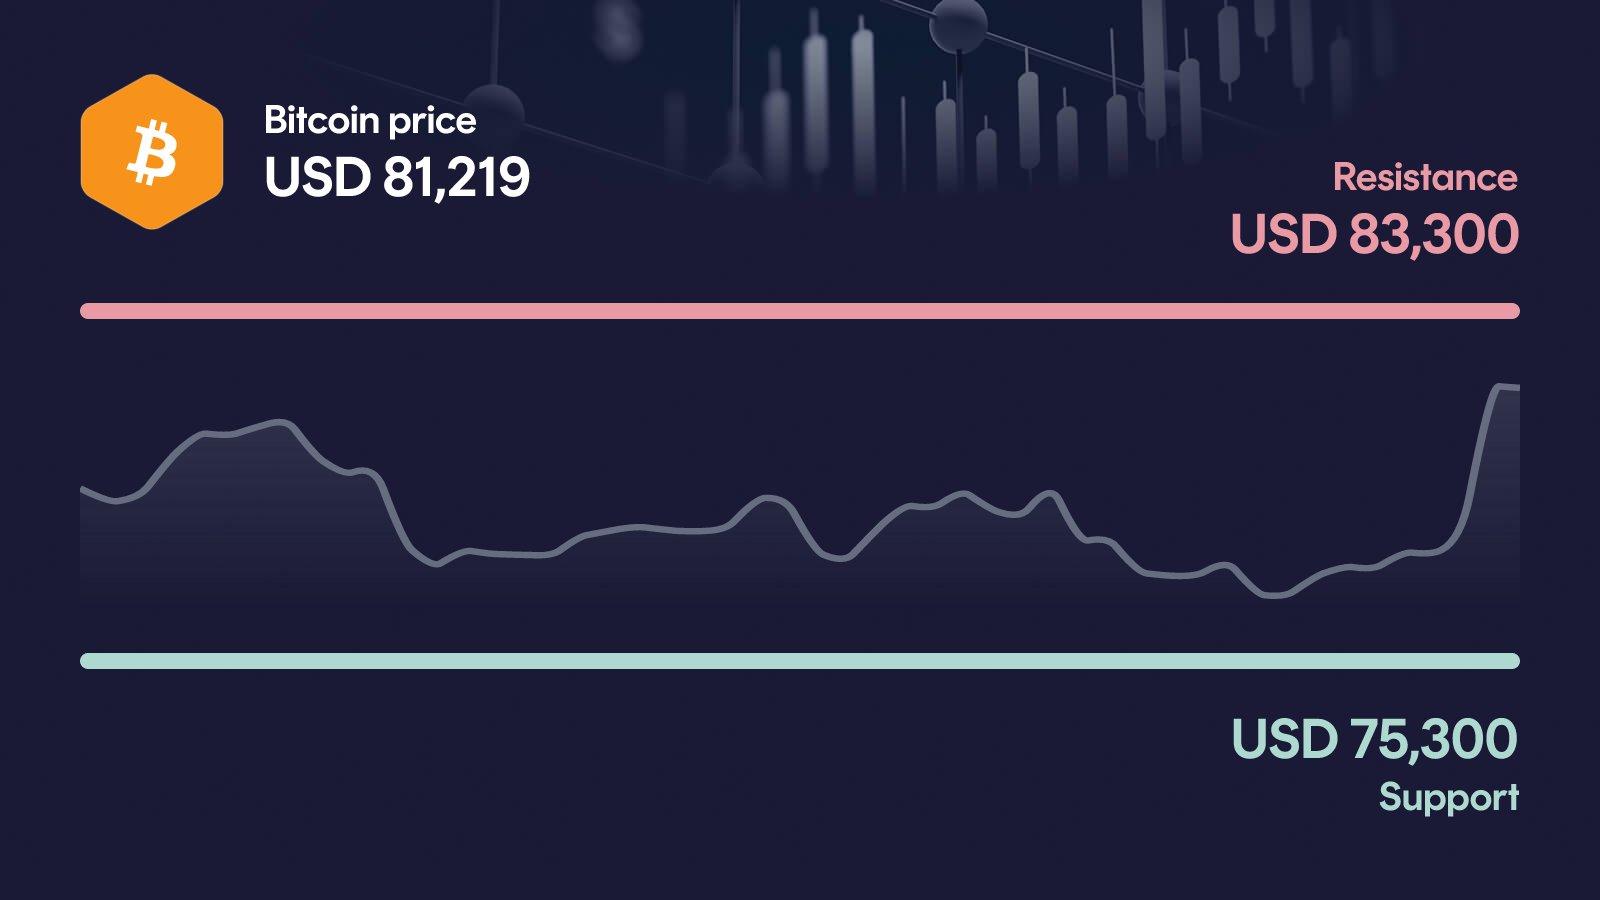
Bitcoin is pushing back toward the weekly high at $82,100, driven by a 4.3% daily jump and volume running 53% above the 30-day average. The move brings BTC within touching distance of a key resistance zone around $83,300, while MACD momentum is quietly starting to fade. Now the question is whether buyers have the strength to force a breakout, or whether this attempt gets rejected once again.
Key takeaways in a nutshell
Strong daily rebound: Bitcoin trades at $81,219 after a 4.3% jump in 24 hours, closing in on the weekly high of $82,100.
Trend clearly intact: BTC sits 19% above the 50-day average ($68,100) and 17% above the 200-day average ($69,500), a firmly bullish structure.
Decision at $83,300: The primary resistance at $83,300 is the key zone: above it, the path opens toward $85,300.
Momentum losing steam: RSI at 65 leaves room, but the MACD histogram has just flipped negative, signaling weakening momentum.
AI sees higher levels: Our AI model projects a 2026 year-end range of $84,965 to $154,817, up to 90.5% above current levels.
What happened to the Bitcoin price?
Bitcoin is trading at $81,219, up 4.3% in 24 hours and back within reach of the weekly high at $82,100. The move is not happening in a vacuum: over 30 days, BTC is up nearly 27%, and volume is running 53% above the 30-day average at almost $43 billion.
That volume expansion is the most interesting detail here. Rebounds that lift price close to a key resistance zone typically fail without participation, but this one is arriving with clearly elevated turnover. The 7-day performance of just 2% shows that BTC has spent most of the week digesting the recent rally rather than extending it.
Key price levels for Bitcoin
The decisive resistance sits at $83,300: a clean daily close above that level would open the path toward the next hurdle at $85,300 and confirm that buyers have absorbed the supply cluster near the weekly high. On the downside, $75,300 is the primary support and the level that has to hold to keep the short-term structure intact. A break below would first expose the secondary support at $73,300, with the 30-day low around $62,500 as the next major orientation point further down.
Bitcoin indicators: RSI, MACD and volume
The three indicators currently paint a mixed picture, and that is what makes the setup so tense. RSI at 65 sits in the upper half of the range but is not yet overheated, leaving room for another push higher. The MACD carries a bearish signal with a recent bearish crossover, and the histogram has just tipped negative after weeks of positive readings, a clear warning that momentum is fading. Volume is 53% above the 30-day average, which shows real participation behind the current move. Taken together, price and volume argue for the bulls, while MACD warns that the underlying momentum is quietly weakening beneath the surface.
Relative Strength Index
MACD
AI forecast for Bitcoin
Looking toward year-end 2026, our AI forecast model places Bitcoin in a range from $84,965 on the conservative end to $154,817 on the optimistic end. The central expected value sits at $114,691, but this should not be read as a price target: it is the midpoint of a broad probability distribution.
The width of that range matters more than the midpoint. In the conservative scenario, BTC would trade only 4.5% above current levels, essentially confirming the recent recovery without a fresh breakout. In the optimistic scenario, an upside of 90.5% would require Bitcoin to break well above its all-time high of $126,100 and enter a new phase of price discovery. The spread reflects how much depends on whether the current resistance zone gives way in the coming weeks.
What could happen now?
Bullish scenario
A clean daily close above $83,300 with volume remaining above the 30-day average would open the path toward the next resistance at $85,300. In that setup, the recent MACD warning would likely be neutralized as the histogram turns back up, while RSI at 65 still has room before entering overbought territory. Bulls would also need to keep volume expanding rather than fading on the breakout attempt. To keep the constructive structure intact, BTC should not lose the $75,300 support again once the breakout is in motion.
Trigger: > $83,300 with elevated volume
Bearish scenario
If $75,300 breaks on a daily close, the short-term picture darkens quickly. The already bearish MACD crossover would gain confirmation, and the fading histogram suggests momentum is on the sellers' side. The next reference level would be the secondary support at $73,300, and below that the 30-day low near $62,500 comes into view as a much deeper orientation point. A move under $73,300 would put clear pressure on the medium-term uptrend, even though BTC still trades well above its 200-day average.
Trigger: < $75,300
Conclusion: Decision at $83,300
The technical setup is constructive, but not without cracks: price and volume argue for the bulls, while MACD momentum is quietly fading. The decisive area is the zone between $83,300 resistance and $75,300 support.
A breakout above $83,300 with strong volume would open the path toward $85,300 and could shift the tone back to clearly bullish. A break below $75,300, on the other hand, would activate $73,300 as the next reference and put the entire recent recovery in question. Until one of these levels gives way, BTC remains in a high-stakes zone where every daily close carries weight. The next few trading days are likely to set the direction.
Want to buy Bitcoin? Kraken is our recommended crypto trading platform.
Continue to KrakenSince 2017, Philipp Duringer has been deeply involved in Bitcoin, crypto assets and digital financial markets. As the founder of Coinbird, he combines years of crypto experience with more than 15 years of technical experience in IT and digital products. His goal is to make crypto easier to understand, more transparent and easier to compare.
About the authorAI-assisted: This price analysis is generated automatically based on structured market data and reviewed through defined quality rules. It is for informational purposes only and is not financial or investment advice or a recommendation to buy or sell crypto assets.