
This Bitcoin price analysis was published on and is not the latest edition.
Bitcoin is rebounding from recent lows and pressing directly into the resistance zone near $65,700, the weekly high. Momentum is improving and a fresh MACD crossover hints at a possible turn, but volume remains clearly below average and price still trades well under the 200-day moving average. Now the market has to show whether this is the start of a real recovery or just another fake-out below key resistance.
Key takeaways in a nutshell
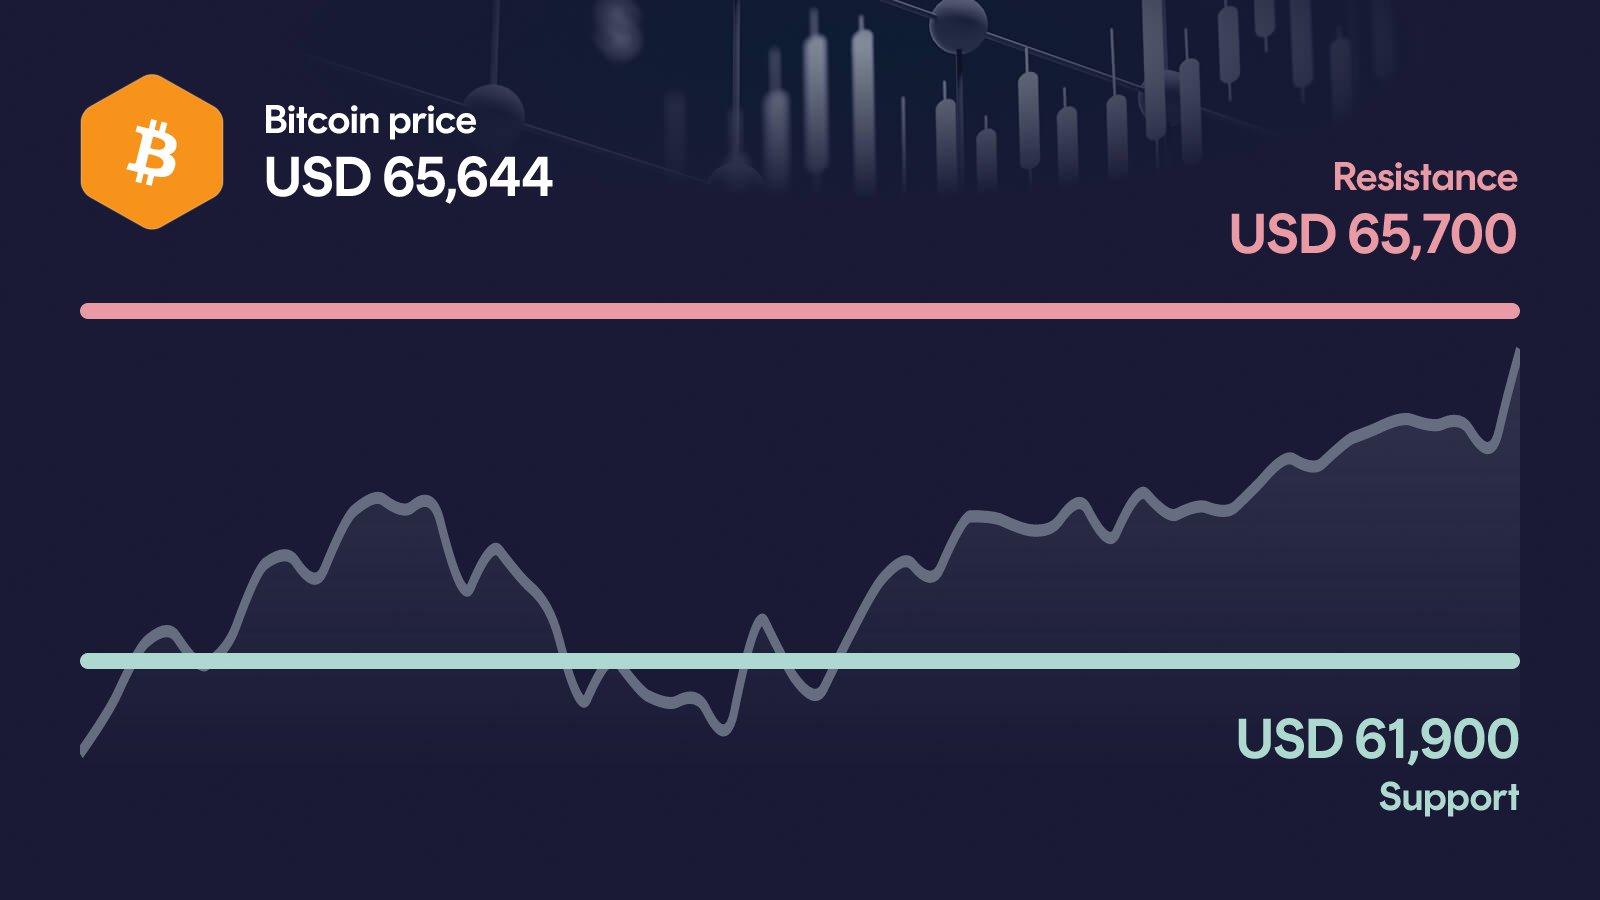
Rebound in progress: Bitcoin trades at $65,644, up 3.76% over the past week but still 16.2% lower on a 30-day basis.
Trend remains broken: Price sits 11.5% below the 50-day average ($74,200) and 15.6% below the 200-day average ($77,800).
Decision at $65,700: The weekly high at $65,700 is the immediate resistance and the gatekeeper for any larger recovery.
Momentum turning: RSI at 36 signals weakness fading, while a fresh bullish MACD crossover hints at a possible shift.
AI sees upside room: For year-end 2026, the model projects a range of $66,171 to $84,965, up to 29.4% above current levels.
What happened to the Bitcoin price?
Bitcoin is trading at $65,644, up 1.91% on the day and 3.76% over the past week. Zooming out, the picture is far less friendly: BTC is still down 16.2% over 30 days and 28.2% over the past 200 days, with the monthly high at $81,600 feeling distant.
The most notable signal is volume. At $25.9 billion in 24-hour turnover, activity is running 25.9% below the 30-day average. The price is pushing right into the weekly high at $65,700, but it is doing so without convincing participation, and that mismatch is the key tension in the current setup.
Key price levels for Bitcoin
These are the key zones now: The resistance at $65,700 is the next major hurdle, and a clean move above it would open the path toward the secondary resistance near $67,100. On the downside, the area around $61,900 acts as support, since it has cushioned the recent rebound. If Bitcoin loses that floor, the next relevant reference shifts down to $59,400, close to the 30-day low at $59,200.
Bitcoin indicators: RSI, MACD and volume
The three indicators currently paint a mixed picture. RSI sits at 36, still in weak territory but no longer oversold, which fits the early-recovery character of the move. The MACD has just turned bullish with a fresh crossover, and the histogram series flipping into positive territory confirms that downside momentum is fading. Volume, however, is 25.9% below the 30-day average, which undermines the strength of the bounce. Taken together, momentum is improving from a low base, but the lack of conviction in volume keeps this rebound fragile.
Relative Strength Index
MACD
AI forecast for Bitcoin
Looking toward year-end 2026, our AI forecast model places Bitcoin in a wide range between $66,171 and $84,965. The central expected value sits at $76,880, which should not be read as a price target but as the midpoint of a broad probability distribution.
The range itself is the more interesting message: it implies that even the conservative case is only 0.77% above the current price, while the optimistic case would mean an upside of 29.4%. In other words, the model sees limited downside from here but a meaningful skew toward recovery if the technical setup improves. Whether BTC ends up in the lower or upper half of that band will depend heavily on how the current resistance test resolves.
What could happen now?
Bullish scenario
If Bitcoin closes decisively above $65,700 and finally pulls in stronger volume, the short-term setup would brighten quickly. The next reference would be the secondary resistance at $67,100, and a sustained move higher would put the 50-day average near $74,200 back into focus. For this to hold, RSI should keep rising without overheating, while the bullish MACD crossover needs follow-through. Above all, the $61,900 support must not be revisited too quickly, otherwise the breakout attempt loses credibility.
Trigger: > $65,700 with elevated volume
Bearish scenario
The decisive level on the downside is $61,900. A clean break below it would invalidate the current rebound and shift attention to the secondary support at $59,400, right next to the 30-day low of $59,200. That zone would then become the last meaningful defense before the move turns into a broader breakdown. With price already sitting more than 15% below the 200-day average, losing $59,400 would put significant additional pressure on the medium-term trend.
Trigger: < $61,900
Conclusion: Decision at $65,700
The technical setup is fragile, but momentum is finally showing the first signs of life after a heavy 30-day pullback. The decisive area is the band between $65,700 resistance and $61,900 support.
If Bitcoin breaks above $65,700 with stronger volume, the recovery gains a real foundation and $67,100 moves into reach. If $61,900 gives way instead, the move toward $59,400 and the 30-day low becomes the more likely path. With RSI lifting off weak levels and MACD turning bullish, the rebound has a base, but weak volume keeps the risk of a fake-out on the table. The next few trading days are likely to set the direction.
Want to buy Bitcoin? Kraken is our recommended crypto trading platform.
Continue to KrakenSince 2017, Philipp Duringer has been deeply involved in Bitcoin, crypto assets and digital financial markets. As the founder of Coinbird, he combines years of crypto experience with more than 15 years of technical experience in IT and digital products. His goal is to make crypto easier to understand, more transparent and easier to compare.
About the authorAI-assisted: This price analysis is generated automatically based on structured market data and reviewed through defined quality rules. It is for informational purposes only and is not financial or investment advice or a recommendation to buy or sell crypto assets.